Polish vs Immigrants from Netherlands Master's Degree
COMPARE
Polish
Immigrants from Netherlands
Master's Degree
Master's Degree Comparison
Poles
Immigrants from Netherlands
15.7%
MASTER'S DEGREE
85.0/ 100
METRIC RATING
141st/ 347
METRIC RANK
18.1%
MASTER'S DEGREE
99.9/ 100
METRIC RATING
63rd/ 347
METRIC RANK
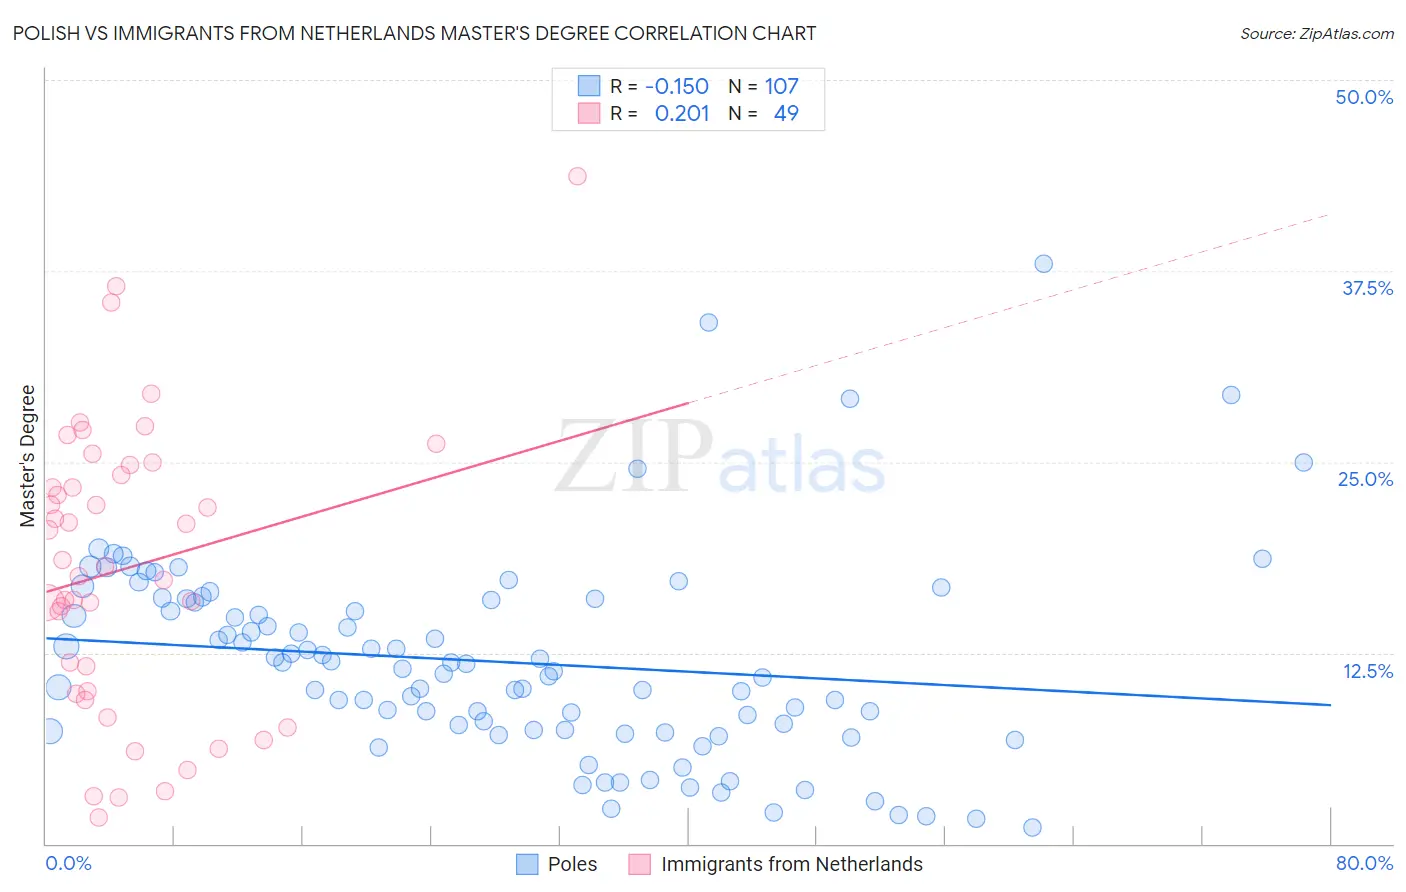
Polish vs Immigrants from Netherlands Master's Degree Correlation Chart
The statistical analysis conducted on geographies consisting of 559,882,025 people shows a poor negative correlation between the proportion of Poles and percentage of population with at least master's degree education in the United States with a correlation coefficient (R) of -0.150 and weighted average of 15.7%. Similarly, the statistical analysis conducted on geographies consisting of 237,861,221 people shows a weak positive correlation between the proportion of Immigrants from Netherlands and percentage of population with at least master's degree education in the United States with a correlation coefficient (R) of 0.201 and weighted average of 18.1%, a difference of 15.0%.
Master's Degree Correlation Summary
| Measurement | Polish | Immigrants from Netherlands |
| Minimum | 1.0% | 1.7% |
| Maximum | 37.9% | 43.7% |
| Range | 36.9% | 41.9% |
| Mean | 11.9% | 18.1% |
| Median | 11.5% | 18.2% |
| Interquartile 25% (IQ1) | 7.4% | 9.9% |
| Interquartile 75% (IQ3) | 16.0% | 24.5% |
| Interquartile Range (IQR) | 8.5% | 14.6% |
| Standard Deviation (Sample) | 6.6% | 9.4% |
| Standard Deviation (Population) | 6.6% | 9.3% |
Similar Demographics by Master's Degree
Demographics Similar to Poles by Master's Degree
In terms of master's degree, the demographic groups most similar to Poles are Vietnamese (15.8%, a difference of 0.12%), Immigrants from Germany (15.8%, a difference of 0.21%), Immigrants from Africa (15.7%, a difference of 0.23%), Pakistani (15.8%, a difference of 0.27%), and Immigrants from Venezuela (15.7%, a difference of 0.32%).
| Demographics | Rating | Rank | Master's Degree |
| Venezuelans | 88.4 /100 | #134 | Excellent 15.9% |
| South American Indians | 88.4 /100 | #135 | Excellent 15.9% |
| Assyrians/Chaldeans/Syriacs | 86.8 /100 | #136 | Excellent 15.8% |
| Europeans | 86.4 /100 | #137 | Excellent 15.8% |
| Pakistanis | 86.1 /100 | #138 | Excellent 15.8% |
| Immigrants | Germany | 85.9 /100 | #139 | Excellent 15.8% |
| Vietnamese | 85.5 /100 | #140 | Excellent 15.8% |
| Poles | 85.0 /100 | #141 | Excellent 15.7% |
| Immigrants | Africa | 84.0 /100 | #142 | Excellent 15.7% |
| Immigrants | Venezuela | 83.6 /100 | #143 | Excellent 15.7% |
| Canadians | 83.3 /100 | #144 | Excellent 15.7% |
| South Americans | 81.3 /100 | #145 | Excellent 15.6% |
| Immigrants | Afghanistan | 79.4 /100 | #146 | Good 15.6% |
| Hungarians | 79.1 /100 | #147 | Good 15.6% |
| Immigrants | Senegal | 78.2 /100 | #148 | Good 15.5% |
Demographics Similar to Immigrants from Netherlands by Master's Degree
In terms of master's degree, the demographic groups most similar to Immigrants from Netherlands are South African (18.1%, a difference of 0.080%), Argentinean (18.2%, a difference of 0.36%), Immigrants from Europe (18.2%, a difference of 0.72%), Immigrants from Kazakhstan (18.0%, a difference of 0.78%), and Ethiopian (18.0%, a difference of 0.80%).
| Demographics | Rating | Rank | Master's Degree |
| Asians | 99.9 /100 | #56 | Exceptional 18.4% |
| Immigrants | Asia | 99.9 /100 | #57 | Exceptional 18.4% |
| Australians | 99.9 /100 | #58 | Exceptional 18.4% |
| Immigrants | Bulgaria | 99.9 /100 | #59 | Exceptional 18.3% |
| New Zealanders | 99.9 /100 | #60 | Exceptional 18.3% |
| Immigrants | Europe | 99.9 /100 | #61 | Exceptional 18.2% |
| Argentineans | 99.9 /100 | #62 | Exceptional 18.2% |
| Immigrants | Netherlands | 99.9 /100 | #63 | Exceptional 18.1% |
| South Africans | 99.9 /100 | #64 | Exceptional 18.1% |
| Immigrants | Kazakhstan | 99.8 /100 | #65 | Exceptional 18.0% |
| Ethiopians | 99.8 /100 | #66 | Exceptional 18.0% |
| Immigrants | Argentina | 99.8 /100 | #67 | Exceptional 18.0% |
| Immigrants | Ethiopia | 99.8 /100 | #68 | Exceptional 17.9% |
| Immigrants | Uzbekistan | 99.8 /100 | #69 | Exceptional 17.9% |
| Immigrants | Western Europe | 99.8 /100 | #70 | Exceptional 17.8% |