Blackfeet vs Immigrants from Netherlands Master's Degree
COMPARE
Blackfeet
Immigrants from Netherlands
Master's Degree
Master's Degree Comparison
Blackfeet
Immigrants from Netherlands
12.1%
MASTER'S DEGREE
0.3/ 100
METRIC RATING
273rd/ 347
METRIC RANK
18.1%
MASTER'S DEGREE
99.9/ 100
METRIC RATING
63rd/ 347
METRIC RANK
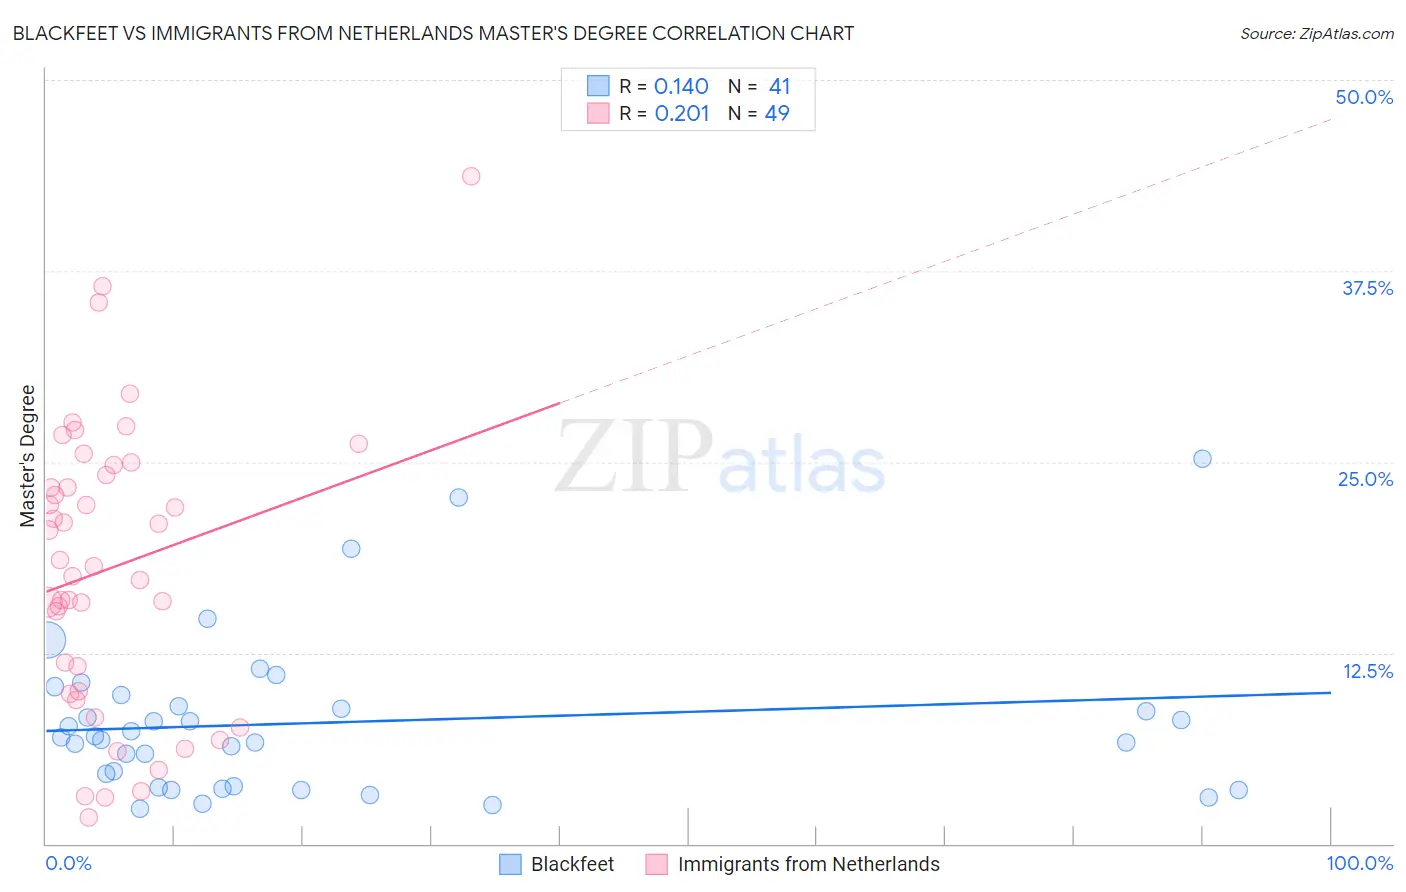
Blackfeet vs Immigrants from Netherlands Master's Degree Correlation Chart
The statistical analysis conducted on geographies consisting of 309,479,249 people shows a poor positive correlation between the proportion of Blackfeet and percentage of population with at least master's degree education in the United States with a correlation coefficient (R) of 0.140 and weighted average of 12.1%. Similarly, the statistical analysis conducted on geographies consisting of 237,861,221 people shows a weak positive correlation between the proportion of Immigrants from Netherlands and percentage of population with at least master's degree education in the United States with a correlation coefficient (R) of 0.201 and weighted average of 18.1%, a difference of 49.9%.
Master's Degree Correlation Summary
| Measurement | Blackfeet | Immigrants from Netherlands |
| Minimum | 2.3% | 1.7% |
| Maximum | 25.2% | 43.7% |
| Range | 22.9% | 41.9% |
| Mean | 7.9% | 18.1% |
| Median | 7.0% | 18.2% |
| Interquartile 25% (IQ1) | 3.7% | 9.9% |
| Interquartile 75% (IQ3) | 9.3% | 24.5% |
| Interquartile Range (IQR) | 5.6% | 14.6% |
| Standard Deviation (Sample) | 5.1% | 9.4% |
| Standard Deviation (Population) | 5.1% | 9.3% |
Similar Demographics by Master's Degree
Demographics Similar to Blackfeet by Master's Degree
In terms of master's degree, the demographic groups most similar to Blackfeet are Comanche (12.1%, a difference of 0.090%), Cape Verdean (12.1%, a difference of 0.090%), Cuban (12.1%, a difference of 0.10%), Haitian (12.1%, a difference of 0.15%), and Black/African American (12.1%, a difference of 0.16%).
| Demographics | Rating | Rank | Master's Degree |
| Bahamians | 0.5 /100 | #266 | Tragic 12.4% |
| Americans | 0.4 /100 | #267 | Tragic 12.3% |
| Native Hawaiians | 0.4 /100 | #268 | Tragic 12.3% |
| Central Americans | 0.3 /100 | #269 | Tragic 12.2% |
| Salvadorans | 0.3 /100 | #270 | Tragic 12.2% |
| Haitians | 0.3 /100 | #271 | Tragic 12.1% |
| Comanche | 0.3 /100 | #272 | Tragic 12.1% |
| Blackfeet | 0.3 /100 | #273 | Tragic 12.1% |
| Cape Verdeans | 0.3 /100 | #274 | Tragic 12.1% |
| Cubans | 0.3 /100 | #275 | Tragic 12.1% |
| Blacks/African Americans | 0.3 /100 | #276 | Tragic 12.1% |
| Immigrants | Caribbean | 0.3 /100 | #277 | Tragic 12.1% |
| Potawatomi | 0.3 /100 | #278 | Tragic 12.1% |
| Immigrants | Belize | 0.2 /100 | #279 | Tragic 12.1% |
| Immigrants | Dominican Republic | 0.2 /100 | #280 | Tragic 12.1% |
Demographics Similar to Immigrants from Netherlands by Master's Degree
In terms of master's degree, the demographic groups most similar to Immigrants from Netherlands are South African (18.1%, a difference of 0.080%), Argentinean (18.2%, a difference of 0.36%), Immigrants from Europe (18.2%, a difference of 0.72%), Immigrants from Kazakhstan (18.0%, a difference of 0.78%), and Ethiopian (18.0%, a difference of 0.80%).
| Demographics | Rating | Rank | Master's Degree |
| Asians | 99.9 /100 | #56 | Exceptional 18.4% |
| Immigrants | Asia | 99.9 /100 | #57 | Exceptional 18.4% |
| Australians | 99.9 /100 | #58 | Exceptional 18.4% |
| Immigrants | Bulgaria | 99.9 /100 | #59 | Exceptional 18.3% |
| New Zealanders | 99.9 /100 | #60 | Exceptional 18.3% |
| Immigrants | Europe | 99.9 /100 | #61 | Exceptional 18.2% |
| Argentineans | 99.9 /100 | #62 | Exceptional 18.2% |
| Immigrants | Netherlands | 99.9 /100 | #63 | Exceptional 18.1% |
| South Africans | 99.9 /100 | #64 | Exceptional 18.1% |
| Immigrants | Kazakhstan | 99.8 /100 | #65 | Exceptional 18.0% |
| Ethiopians | 99.8 /100 | #66 | Exceptional 18.0% |
| Immigrants | Argentina | 99.8 /100 | #67 | Exceptional 18.0% |
| Immigrants | Ethiopia | 99.8 /100 | #68 | Exceptional 17.9% |
| Immigrants | Uzbekistan | 99.8 /100 | #69 | Exceptional 17.9% |
| Immigrants | Western Europe | 99.8 /100 | #70 | Exceptional 17.8% |