Polish vs Immigrants from Netherlands 9th Grade
COMPARE
Polish
Immigrants from Netherlands
9th Grade
9th Grade Comparison
Poles
Immigrants from Netherlands
96.7%
9TH GRADE
100.0/ 100
METRIC RATING
6th/ 347
METRIC RANK
95.8%
9TH GRADE
99.6/ 100
METRIC RATING
66th/ 347
METRIC RANK
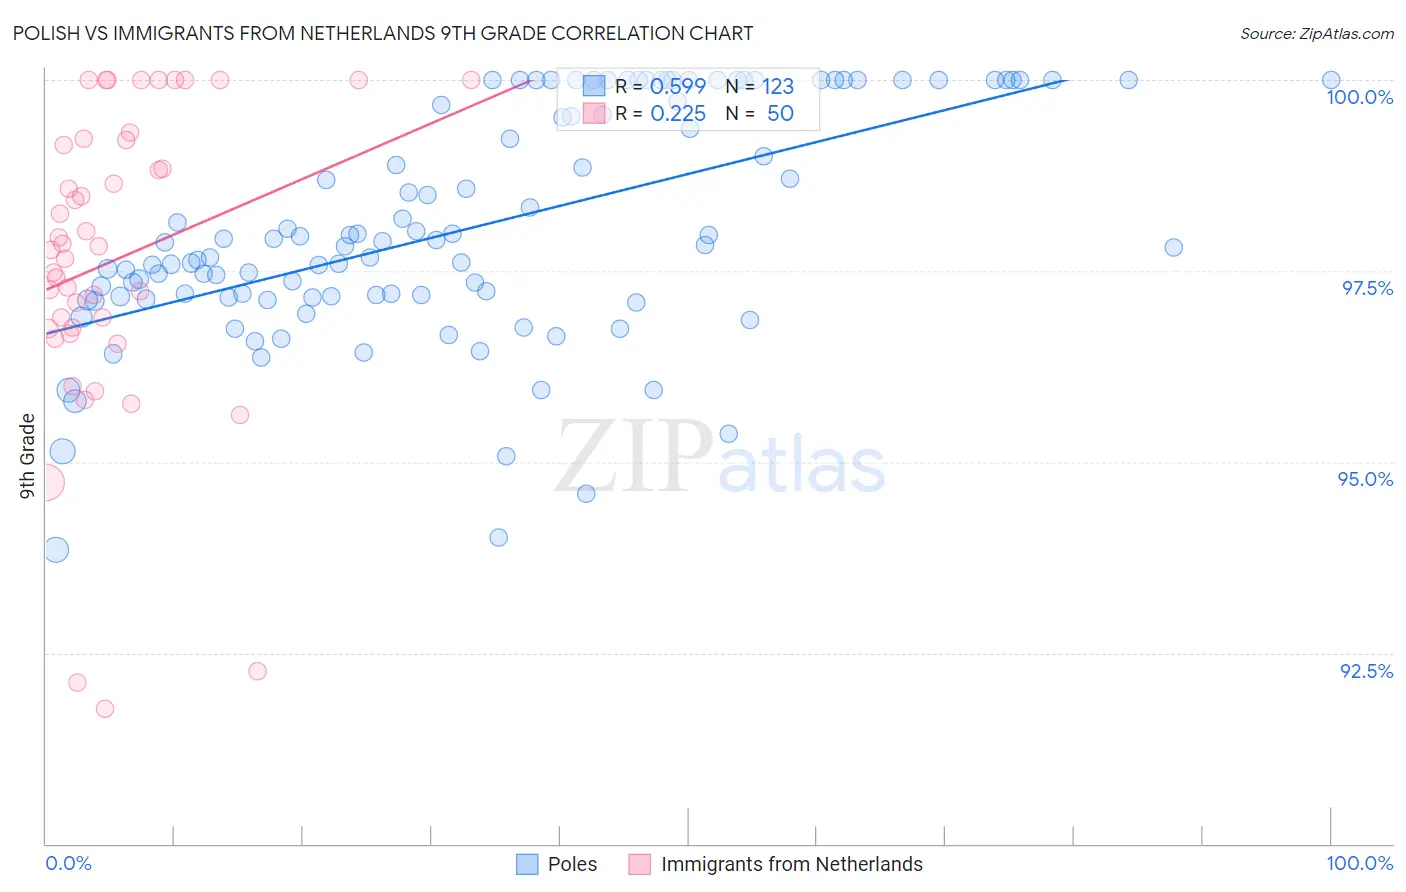
Polish vs Immigrants from Netherlands 9th Grade Correlation Chart
The statistical analysis conducted on geographies consisting of 475,812,379 people shows a substantial positive correlation between the proportion of Poles and percentage of population with at least 9th grade education in the United States with a correlation coefficient (R) of 0.599 and weighted average of 96.7%. Similarly, the statistical analysis conducted on geographies consisting of 237,869,934 people shows a weak positive correlation between the proportion of Immigrants from Netherlands and percentage of population with at least 9th grade education in the United States with a correlation coefficient (R) of 0.225 and weighted average of 95.8%, a difference of 0.94%.
9th Grade Correlation Summary
| Measurement | Polish | Immigrants from Netherlands |
| Minimum | 93.8% | 91.8% |
| Maximum | 100.0% | 100.0% |
| Range | 6.2% | 8.2% |
| Mean | 98.1% | 97.6% |
| Median | 97.8% | 97.8% |
| Interquartile 25% (IQ1) | 97.2% | 96.7% |
| Interquartile 75% (IQ3) | 100.0% | 99.2% |
| Interquartile Range (IQR) | 2.8% | 2.5% |
| Standard Deviation (Sample) | 1.5% | 2.0% |
| Standard Deviation (Population) | 1.5% | 2.0% |
Similar Demographics by 9th Grade
Demographics Similar to Poles by 9th Grade
In terms of 9th grade, the demographic groups most similar to Poles are Swedish (96.7%, a difference of 0.010%), Carpatho Rusyn (96.7%, a difference of 0.010%), Slovene (96.7%, a difference of 0.020%), German (96.7%, a difference of 0.020%), and Tlingit-Haida (96.6%, a difference of 0.10%).
| Demographics | Rating | Rank | 9th Grade |
| Tsimshian | 100.0 /100 | #1 | Exceptional 97.0% |
| Norwegians | 100.0 /100 | #2 | Exceptional 96.9% |
| Slovaks | 100.0 /100 | #3 | Exceptional 96.9% |
| Slovenes | 100.0 /100 | #4 | Exceptional 96.7% |
| Swedes | 100.0 /100 | #5 | Exceptional 96.7% |
| Poles | 100.0 /100 | #6 | Exceptional 96.7% |
| Carpatho Rusyns | 100.0 /100 | #7 | Exceptional 96.7% |
| Germans | 100.0 /100 | #8 | Exceptional 96.7% |
| Tlingit-Haida | 100.0 /100 | #9 | Exceptional 96.6% |
| Lithuanians | 100.0 /100 | #10 | Exceptional 96.6% |
| Finns | 100.0 /100 | #11 | Exceptional 96.6% |
| English | 100.0 /100 | #12 | Exceptional 96.6% |
| Danes | 100.0 /100 | #13 | Exceptional 96.5% |
| Scottish | 100.0 /100 | #14 | Exceptional 96.5% |
| Irish | 100.0 /100 | #15 | Exceptional 96.5% |
Demographics Similar to Immigrants from Netherlands by 9th Grade
In terms of 9th grade, the demographic groups most similar to Immigrants from Netherlands are Cypriot (95.8%, a difference of 0.010%), Immigrants from Ireland (95.8%, a difference of 0.010%), Immigrants from Lithuania (95.8%, a difference of 0.010%), Immigrants from England (95.9%, a difference of 0.020%), and Zimbabwean (95.9%, a difference of 0.030%).
| Demographics | Rating | Rank | 9th Grade |
| New Zealanders | 99.8 /100 | #59 | Exceptional 95.9% |
| Native Hawaiians | 99.8 /100 | #60 | Exceptional 95.9% |
| Sioux | 99.8 /100 | #61 | Exceptional 95.9% |
| Ukrainians | 99.7 /100 | #62 | Exceptional 95.9% |
| Canadians | 99.7 /100 | #63 | Exceptional 95.9% |
| Zimbabweans | 99.7 /100 | #64 | Exceptional 95.9% |
| Immigrants | England | 99.6 /100 | #65 | Exceptional 95.9% |
| Immigrants | Netherlands | 99.6 /100 | #66 | Exceptional 95.8% |
| Cypriots | 99.6 /100 | #67 | Exceptional 95.8% |
| Immigrants | Ireland | 99.6 /100 | #68 | Exceptional 95.8% |
| Immigrants | Lithuania | 99.6 /100 | #69 | Exceptional 95.8% |
| Immigrants | Australia | 99.5 /100 | #70 | Exceptional 95.8% |
| Immigrants | Belgium | 99.5 /100 | #71 | Exceptional 95.8% |
| Turks | 99.5 /100 | #72 | Exceptional 95.8% |
| Immigrants | Singapore | 99.5 /100 | #73 | Exceptional 95.8% |