Pima vs Immigrants from Liberia No Schooling Completed
COMPARE
Pima
Immigrants from Liberia
No Schooling Completed
No Schooling Completed Comparison
Pima
Immigrants from Liberia
2.1%
NO SCHOOLING COMPLETED
41.3/ 100
METRIC RATING
184th/ 347
METRIC RANK
2.5%
NO SCHOOLING COMPLETED
0.4/ 100
METRIC RATING
263rd/ 347
METRIC RANK
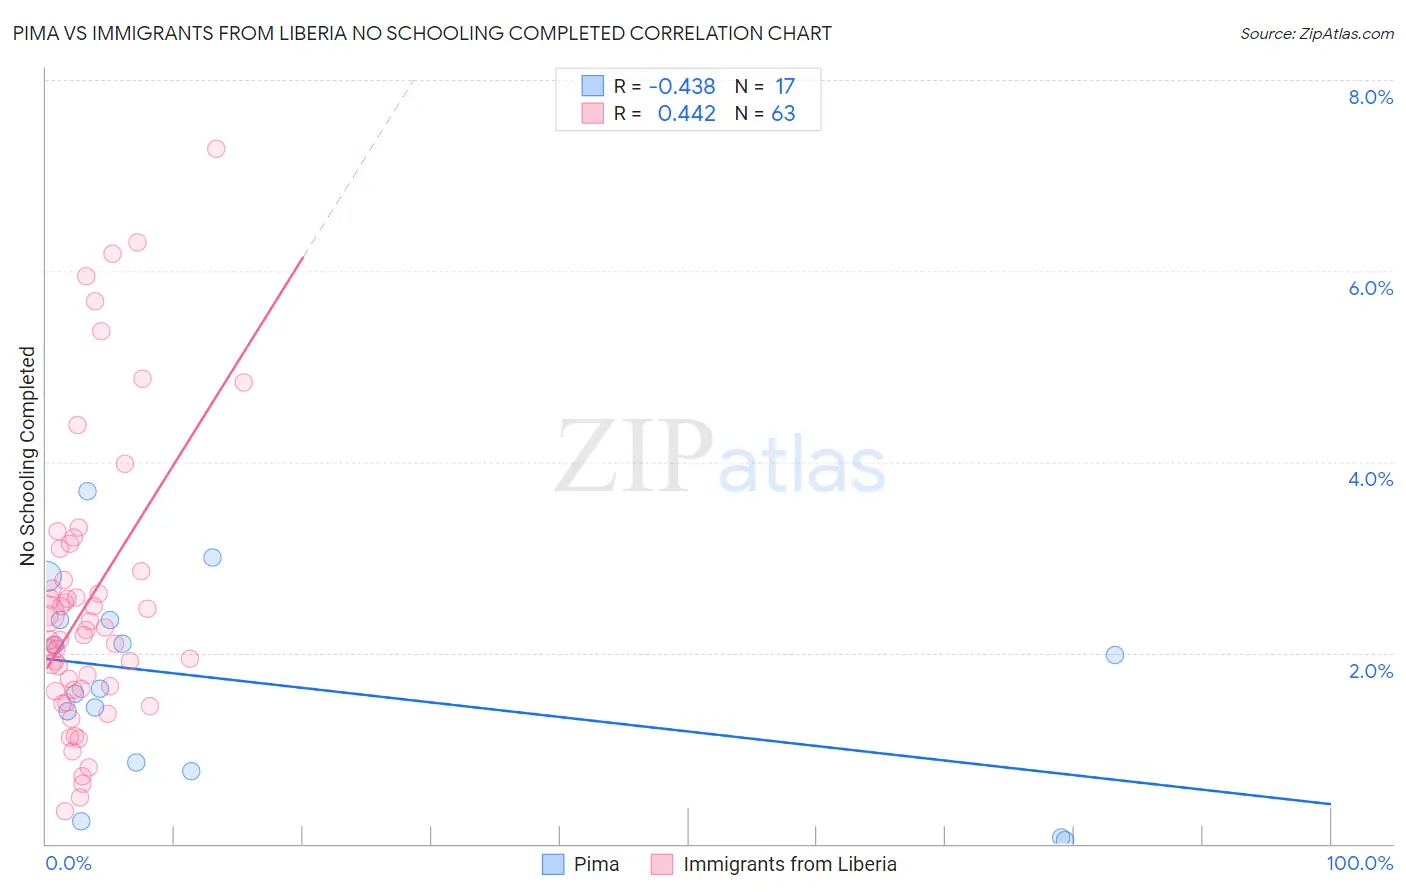
Pima vs Immigrants from Liberia No Schooling Completed Correlation Chart
The statistical analysis conducted on geographies consisting of 61,416,926 people shows a moderate negative correlation between the proportion of Pima and percentage of population with no schooling in the United States with a correlation coefficient (R) of -0.438 and weighted average of 2.1%. Similarly, the statistical analysis conducted on geographies consisting of 134,971,169 people shows a moderate positive correlation between the proportion of Immigrants from Liberia and percentage of population with no schooling in the United States with a correlation coefficient (R) of 0.442 and weighted average of 2.5%, a difference of 16.8%.
No Schooling Completed Correlation Summary
| Measurement | Pima | Immigrants from Liberia |
| Minimum | 0.035% | 0.34% |
| Maximum | 3.7% | 7.3% |
| Range | 3.7% | 6.9% |
| Mean | 1.7% | 2.5% |
| Median | 1.6% | 2.2% |
| Interquartile 25% (IQ1) | 0.80% | 1.6% |
| Interquartile 75% (IQ3) | 2.3% | 2.9% |
| Interquartile Range (IQR) | 1.5% | 1.2% |
| Standard Deviation (Sample) | 1.0% | 1.5% |
| Standard Deviation (Population) | 1.0% | 1.5% |
Similar Demographics by No Schooling Completed
Demographics Similar to Pima by No Schooling Completed
In terms of no schooling completed, the demographic groups most similar to Pima are Black/African American (2.1%, a difference of 0.020%), Mongolian (2.1%, a difference of 0.070%), French American Indian (2.1%, a difference of 0.12%), Immigrants from Taiwan (2.1%, a difference of 0.17%), and Portuguese (2.1%, a difference of 0.35%).
| Demographics | Rating | Rank | No Schooling Completed |
| Arapaho | 45.0 /100 | #177 | Average 2.1% |
| Pakistanis | 44.7 /100 | #178 | Average 2.1% |
| Immigrants | Kazakhstan | 44.3 /100 | #179 | Average 2.1% |
| Portuguese | 43.9 /100 | #180 | Average 2.1% |
| Immigrants | Taiwan | 42.6 /100 | #181 | Average 2.1% |
| French American Indians | 42.2 /100 | #182 | Average 2.1% |
| Blacks/African Americans | 41.4 /100 | #183 | Average 2.1% |
| Pima | 41.3 /100 | #184 | Average 2.1% |
| Mongolians | 40.8 /100 | #185 | Average 2.1% |
| Immigrants | Bosnia and Herzegovina | 38.6 /100 | #186 | Fair 2.1% |
| Navajo | 36.5 /100 | #187 | Fair 2.1% |
| Immigrants | Kenya | 36.2 /100 | #188 | Fair 2.1% |
| Immigrants | Egypt | 36.1 /100 | #189 | Fair 2.1% |
| Spanish Americans | 32.6 /100 | #190 | Fair 2.1% |
| Bermudans | 30.7 /100 | #191 | Fair 2.1% |
Demographics Similar to Immigrants from Liberia by No Schooling Completed
In terms of no schooling completed, the demographic groups most similar to Immigrants from Liberia are Indian (Asian) (2.5%, a difference of 0.13%), Immigrants from Sierra Leone (2.5%, a difference of 0.17%), West Indian (2.5%, a difference of 0.31%), Fijian (2.5%, a difference of 0.39%), and Armenian (2.5%, a difference of 0.52%).
| Demographics | Rating | Rank | No Schooling Completed |
| Yaqui | 0.8 /100 | #256 | Tragic 2.4% |
| Immigrants | South America | 0.6 /100 | #257 | Tragic 2.5% |
| Assyrians/Chaldeans/Syriacs | 0.6 /100 | #258 | Tragic 2.5% |
| Immigrants | Jamaica | 0.6 /100 | #259 | Tragic 2.5% |
| Immigrants | Ethiopia | 0.6 /100 | #260 | Tragic 2.5% |
| Armenians | 0.5 /100 | #261 | Tragic 2.5% |
| Immigrants | Sierra Leone | 0.5 /100 | #262 | Tragic 2.5% |
| Immigrants | Liberia | 0.4 /100 | #263 | Tragic 2.5% |
| Indians (Asian) | 0.4 /100 | #264 | Tragic 2.5% |
| West Indians | 0.4 /100 | #265 | Tragic 2.5% |
| Fijians | 0.4 /100 | #266 | Tragic 2.5% |
| Yuman | 0.4 /100 | #267 | Tragic 2.5% |
| Taiwanese | 0.3 /100 | #268 | Tragic 2.5% |
| Immigrants | Nigeria | 0.2 /100 | #269 | Tragic 2.5% |
| Immigrants | Peru | 0.2 /100 | #270 | Tragic 2.5% |