Pima vs Immigrants from Haiti No Schooling Completed
COMPARE
Pima
Immigrants from Haiti
No Schooling Completed
No Schooling Completed Comparison
Pima
Immigrants from Haiti
2.1%
NO SCHOOLING COMPLETED
41.3/ 100
METRIC RATING
184th/ 347
METRIC RANK
3.0%
NO SCHOOLING COMPLETED
0.0/ 100
METRIC RATING
307th/ 347
METRIC RANK
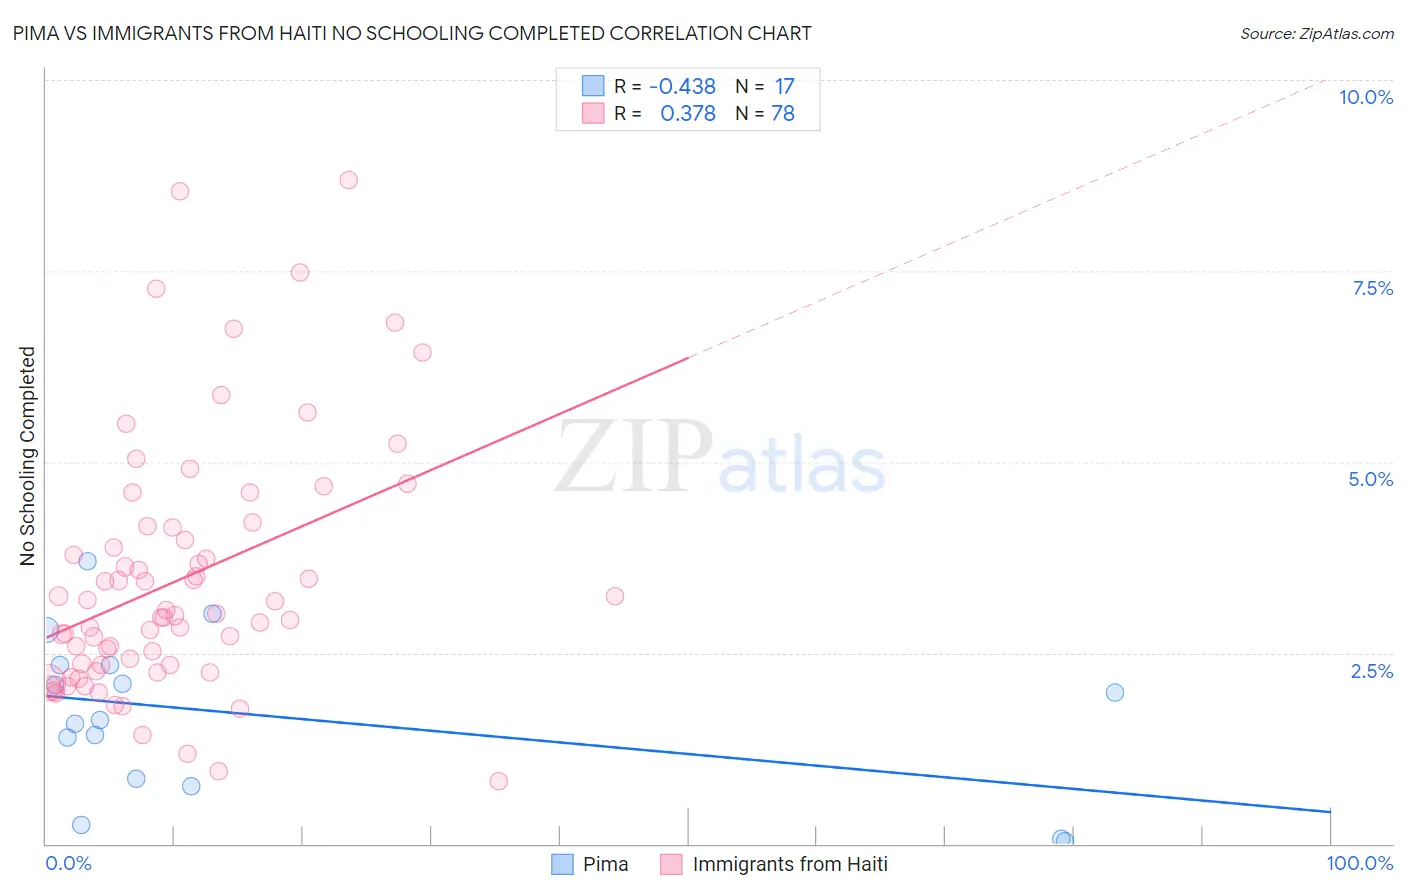
Pima vs Immigrants from Haiti No Schooling Completed Correlation Chart
The statistical analysis conducted on geographies consisting of 61,416,926 people shows a moderate negative correlation between the proportion of Pima and percentage of population with no schooling in the United States with a correlation coefficient (R) of -0.438 and weighted average of 2.1%. Similarly, the statistical analysis conducted on geographies consisting of 224,149,714 people shows a mild positive correlation between the proportion of Immigrants from Haiti and percentage of population with no schooling in the United States with a correlation coefficient (R) of 0.378 and weighted average of 3.0%, a difference of 42.1%.
No Schooling Completed Correlation Summary
| Measurement | Pima | Immigrants from Haiti |
| Minimum | 0.035% | 0.82% |
| Maximum | 3.7% | 8.7% |
| Range | 3.7% | 7.9% |
| Mean | 1.7% | 3.5% |
| Median | 1.6% | 3.0% |
| Interquartile 25% (IQ1) | 0.80% | 2.3% |
| Interquartile 75% (IQ3) | 2.3% | 4.1% |
| Interquartile Range (IQR) | 1.5% | 1.8% |
| Standard Deviation (Sample) | 1.0% | 1.7% |
| Standard Deviation (Population) | 1.0% | 1.6% |
Similar Demographics by No Schooling Completed
Demographics Similar to Pima by No Schooling Completed
In terms of no schooling completed, the demographic groups most similar to Pima are Black/African American (2.1%, a difference of 0.020%), Mongolian (2.1%, a difference of 0.070%), French American Indian (2.1%, a difference of 0.12%), Immigrants from Taiwan (2.1%, a difference of 0.17%), and Portuguese (2.1%, a difference of 0.35%).
| Demographics | Rating | Rank | No Schooling Completed |
| Arapaho | 45.0 /100 | #177 | Average 2.1% |
| Pakistanis | 44.7 /100 | #178 | Average 2.1% |
| Immigrants | Kazakhstan | 44.3 /100 | #179 | Average 2.1% |
| Portuguese | 43.9 /100 | #180 | Average 2.1% |
| Immigrants | Taiwan | 42.6 /100 | #181 | Average 2.1% |
| French American Indians | 42.2 /100 | #182 | Average 2.1% |
| Blacks/African Americans | 41.4 /100 | #183 | Average 2.1% |
| Pima | 41.3 /100 | #184 | Average 2.1% |
| Mongolians | 40.8 /100 | #185 | Average 2.1% |
| Immigrants | Bosnia and Herzegovina | 38.6 /100 | #186 | Fair 2.1% |
| Navajo | 36.5 /100 | #187 | Fair 2.1% |
| Immigrants | Kenya | 36.2 /100 | #188 | Fair 2.1% |
| Immigrants | Egypt | 36.1 /100 | #189 | Fair 2.1% |
| Spanish Americans | 32.6 /100 | #190 | Fair 2.1% |
| Bermudans | 30.7 /100 | #191 | Fair 2.1% |
Demographics Similar to Immigrants from Haiti by No Schooling Completed
In terms of no schooling completed, the demographic groups most similar to Immigrants from Haiti are Belizean (3.0%, a difference of 0.080%), Immigrants from Somalia (3.0%, a difference of 0.16%), Hispanic or Latino (3.0%, a difference of 0.97%), Guyanese (3.0%, a difference of 1.0%), and Immigrants from the Azores (3.0%, a difference of 1.1%).
| Demographics | Rating | Rank | No Schooling Completed |
| Haitians | 0.0 /100 | #300 | Tragic 2.9% |
| Immigrants | South Eastern Asia | 0.0 /100 | #301 | Tragic 2.9% |
| Immigrants | Caribbean | 0.0 /100 | #302 | Tragic 2.9% |
| Somalis | 0.0 /100 | #303 | Tragic 2.9% |
| Nicaraguans | 0.0 /100 | #304 | Tragic 2.9% |
| Ecuadorians | 0.0 /100 | #305 | Tragic 3.0% |
| Belizeans | 0.0 /100 | #306 | Tragic 3.0% |
| Immigrants | Haiti | 0.0 /100 | #307 | Tragic 3.0% |
| Immigrants | Somalia | 0.0 /100 | #308 | Tragic 3.0% |
| Hispanics or Latinos | 0.0 /100 | #309 | Tragic 3.0% |
| Guyanese | 0.0 /100 | #310 | Tragic 3.0% |
| Immigrants | Azores | 0.0 /100 | #311 | Tragic 3.0% |
| Sri Lankans | 0.0 /100 | #312 | Tragic 3.0% |
| Hondurans | 0.0 /100 | #313 | Tragic 3.1% |
| Immigrants | Belize | 0.0 /100 | #314 | Tragic 3.1% |