Pima vs Immigrants from Vietnam No Schooling Completed
COMPARE
Pima
Immigrants from Vietnam
No Schooling Completed
No Schooling Completed Comparison
Pima
Immigrants from Vietnam
2.1%
NO SCHOOLING COMPLETED
41.3/ 100
METRIC RATING
184th/ 347
METRIC RANK
3.3%
NO SCHOOLING COMPLETED
0.0/ 100
METRIC RATING
329th/ 347
METRIC RANK
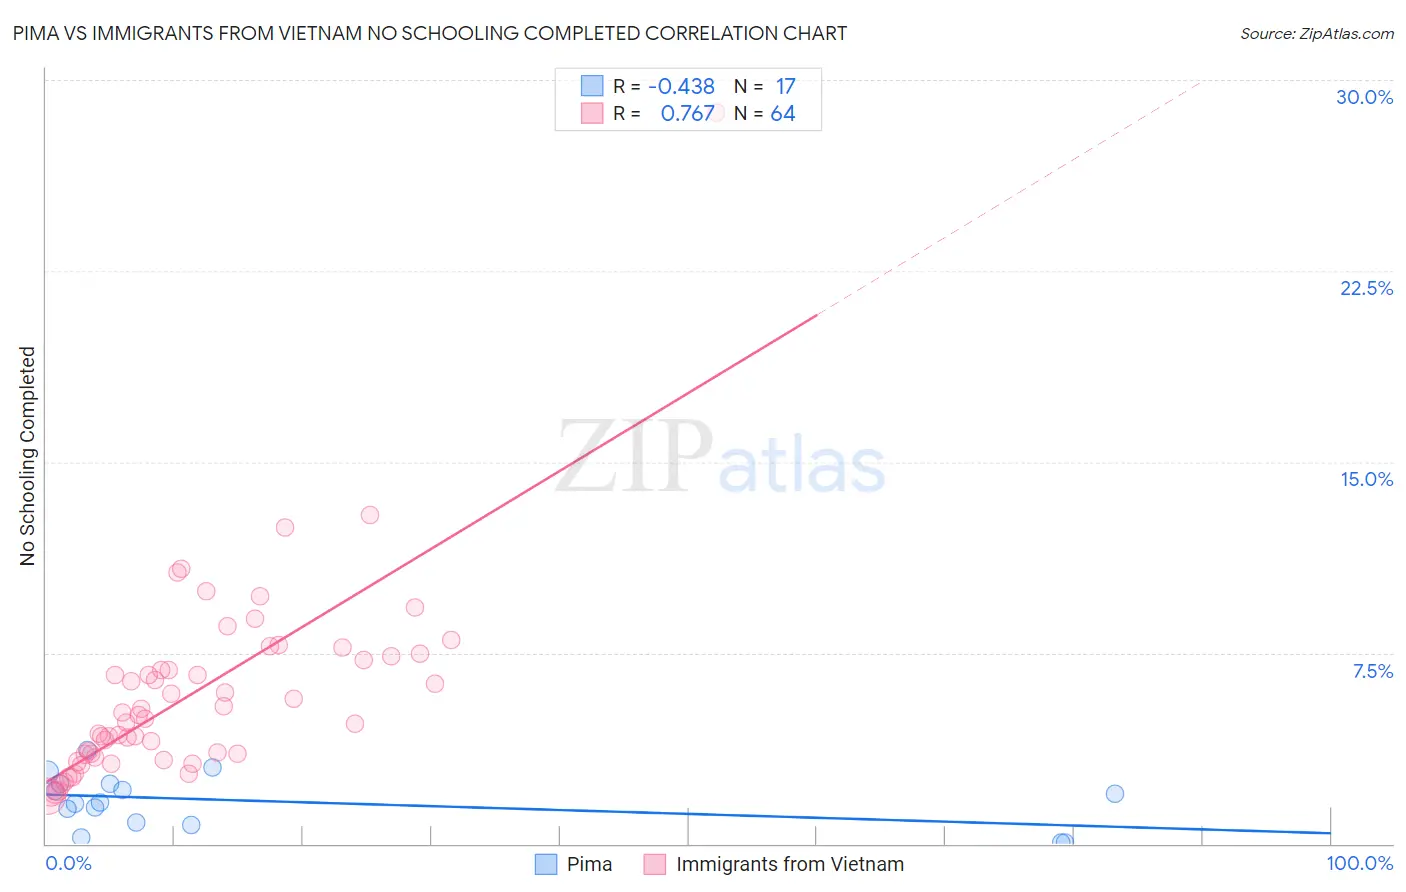
Pima vs Immigrants from Vietnam No Schooling Completed Correlation Chart
The statistical analysis conducted on geographies consisting of 61,416,926 people shows a moderate negative correlation between the proportion of Pima and percentage of population with no schooling in the United States with a correlation coefficient (R) of -0.438 and weighted average of 2.1%. Similarly, the statistical analysis conducted on geographies consisting of 401,890,779 people shows a strong positive correlation between the proportion of Immigrants from Vietnam and percentage of population with no schooling in the United States with a correlation coefficient (R) of 0.767 and weighted average of 3.3%, a difference of 57.5%.
No Schooling Completed Correlation Summary
| Measurement | Pima | Immigrants from Vietnam |
| Minimum | 0.035% | 1.9% |
| Maximum | 3.7% | 28.7% |
| Range | 3.7% | 26.8% |
| Mean | 1.7% | 5.9% |
| Median | 1.6% | 5.0% |
| Interquartile 25% (IQ1) | 0.80% | 3.5% |
| Interquartile 75% (IQ3) | 2.3% | 7.3% |
| Interquartile Range (IQR) | 1.5% | 3.8% |
| Standard Deviation (Sample) | 1.0% | 3.9% |
| Standard Deviation (Population) | 1.0% | 3.9% |
Similar Demographics by No Schooling Completed
Demographics Similar to Pima by No Schooling Completed
In terms of no schooling completed, the demographic groups most similar to Pima are Black/African American (2.1%, a difference of 0.020%), Mongolian (2.1%, a difference of 0.070%), French American Indian (2.1%, a difference of 0.12%), Immigrants from Taiwan (2.1%, a difference of 0.17%), and Portuguese (2.1%, a difference of 0.35%).
| Demographics | Rating | Rank | No Schooling Completed |
| Arapaho | 45.0 /100 | #177 | Average 2.1% |
| Pakistanis | 44.7 /100 | #178 | Average 2.1% |
| Immigrants | Kazakhstan | 44.3 /100 | #179 | Average 2.1% |
| Portuguese | 43.9 /100 | #180 | Average 2.1% |
| Immigrants | Taiwan | 42.6 /100 | #181 | Average 2.1% |
| French American Indians | 42.2 /100 | #182 | Average 2.1% |
| Blacks/African Americans | 41.4 /100 | #183 | Average 2.1% |
| Pima | 41.3 /100 | #184 | Average 2.1% |
| Mongolians | 40.8 /100 | #185 | Average 2.1% |
| Immigrants | Bosnia and Herzegovina | 38.6 /100 | #186 | Fair 2.1% |
| Navajo | 36.5 /100 | #187 | Fair 2.1% |
| Immigrants | Kenya | 36.2 /100 | #188 | Fair 2.1% |
| Immigrants | Egypt | 36.1 /100 | #189 | Fair 2.1% |
| Spanish Americans | 32.6 /100 | #190 | Fair 2.1% |
| Bermudans | 30.7 /100 | #191 | Fair 2.1% |
Demographics Similar to Immigrants from Vietnam by No Schooling Completed
In terms of no schooling completed, the demographic groups most similar to Immigrants from Vietnam are Immigrants from Armenia (3.3%, a difference of 0.42%), Japanese (3.3%, a difference of 0.45%), Mexican (3.3%, a difference of 1.1%), Immigrants from Latin America (3.3%, a difference of 1.3%), and Central American (3.4%, a difference of 2.0%).
| Demographics | Rating | Rank | No Schooling Completed |
| Immigrants | Honduras | 0.0 /100 | #322 | Tragic 3.2% |
| Vietnamese | 0.0 /100 | #323 | Tragic 3.2% |
| Mexican American Indians | 0.0 /100 | #324 | Tragic 3.2% |
| Dominicans | 0.0 /100 | #325 | Tragic 3.2% |
| Indonesians | 0.0 /100 | #326 | Tragic 3.2% |
| Immigrants | Latin America | 0.0 /100 | #327 | Tragic 3.3% |
| Mexicans | 0.0 /100 | #328 | Tragic 3.3% |
| Immigrants | Vietnam | 0.0 /100 | #329 | Tragic 3.3% |
| Immigrants | Armenia | 0.0 /100 | #330 | Tragic 3.3% |
| Japanese | 0.0 /100 | #331 | Tragic 3.3% |
| Central Americans | 0.0 /100 | #332 | Tragic 3.4% |
| Immigrants | Dominican Republic | 0.0 /100 | #333 | Tragic 3.4% |
| Guatemalans | 0.0 /100 | #334 | Tragic 3.5% |
| Immigrants | Cambodia | 0.0 /100 | #335 | Tragic 3.5% |
| Immigrants | Fiji | 0.0 /100 | #336 | Tragic 3.5% |