Pima vs Menominee No Schooling Completed
COMPARE
Pima
Menominee
No Schooling Completed
No Schooling Completed Comparison
Pima
Menominee
2.1%
NO SCHOOLING COMPLETED
41.3/ 100
METRIC RATING
184th/ 347
METRIC RANK
1.9%
NO SCHOOLING COMPLETED
89.6/ 100
METRIC RATING
134th/ 347
METRIC RANK
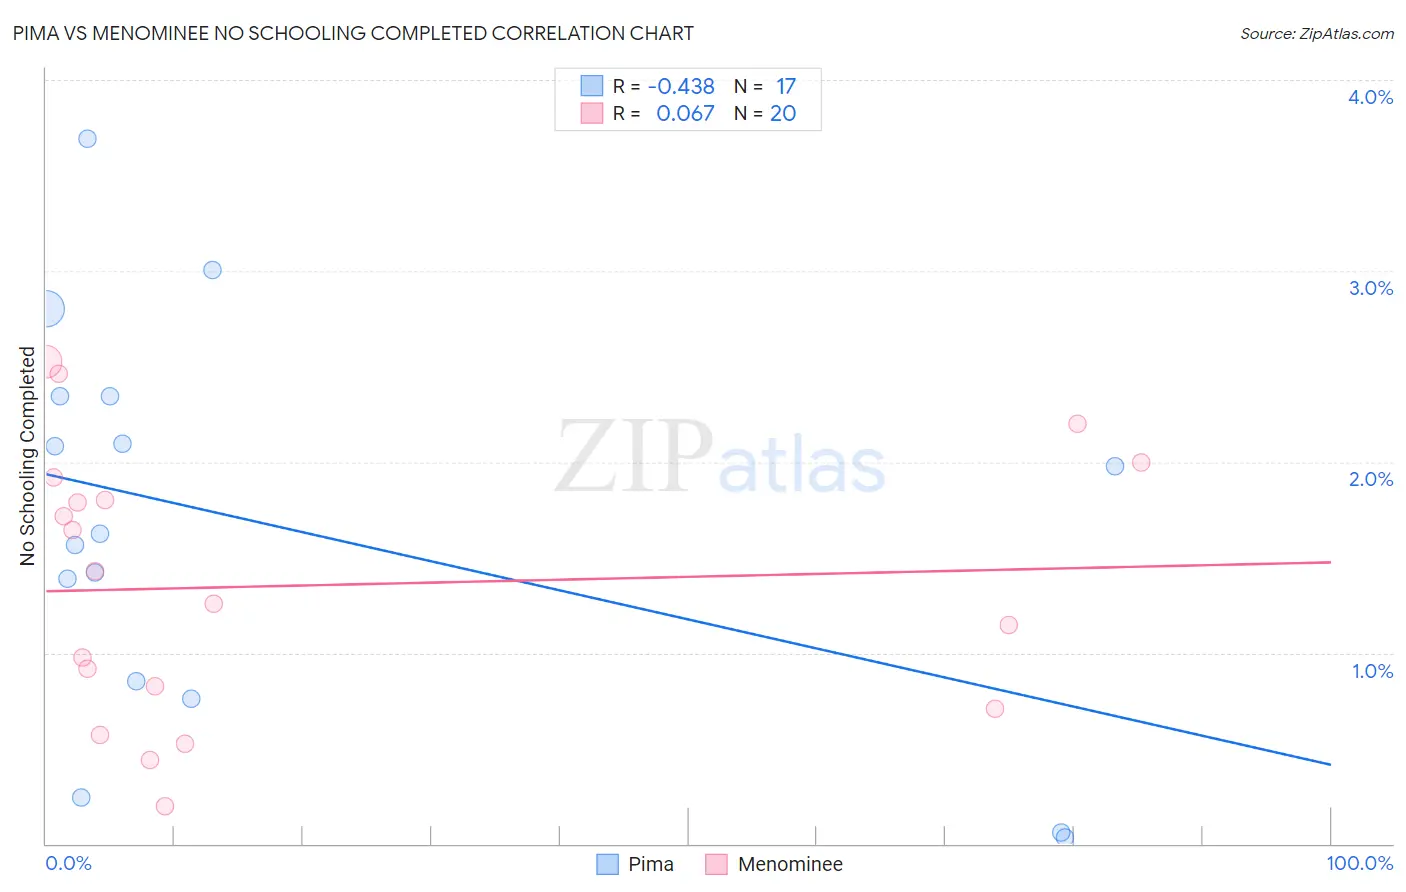
Pima vs Menominee No Schooling Completed Correlation Chart
The statistical analysis conducted on geographies consisting of 61,416,926 people shows a moderate negative correlation between the proportion of Pima and percentage of population with no schooling in the United States with a correlation coefficient (R) of -0.438 and weighted average of 2.1%. Similarly, the statistical analysis conducted on geographies consisting of 45,688,108 people shows a slight positive correlation between the proportion of Menominee and percentage of population with no schooling in the United States with a correlation coefficient (R) of 0.067 and weighted average of 1.9%, a difference of 9.1%.
No Schooling Completed Correlation Summary
| Measurement | Pima | Menominee |
| Minimum | 0.035% | 0.20% |
| Maximum | 3.7% | 2.5% |
| Range | 3.7% | 2.3% |
| Mean | 1.7% | 1.4% |
| Median | 1.6% | 1.3% |
| Interquartile 25% (IQ1) | 0.80% | 0.77% |
| Interquartile 75% (IQ3) | 2.3% | 1.9% |
| Interquartile Range (IQR) | 1.5% | 1.1% |
| Standard Deviation (Sample) | 1.0% | 0.70% |
| Standard Deviation (Population) | 1.0% | 0.68% |
Similar Demographics by No Schooling Completed
Demographics Similar to Pima by No Schooling Completed
In terms of no schooling completed, the demographic groups most similar to Pima are Black/African American (2.1%, a difference of 0.020%), Mongolian (2.1%, a difference of 0.070%), French American Indian (2.1%, a difference of 0.12%), Immigrants from Taiwan (2.1%, a difference of 0.17%), and Portuguese (2.1%, a difference of 0.35%).
| Demographics | Rating | Rank | No Schooling Completed |
| Arapaho | 45.0 /100 | #177 | Average 2.1% |
| Pakistanis | 44.7 /100 | #178 | Average 2.1% |
| Immigrants | Kazakhstan | 44.3 /100 | #179 | Average 2.1% |
| Portuguese | 43.9 /100 | #180 | Average 2.1% |
| Immigrants | Taiwan | 42.6 /100 | #181 | Average 2.1% |
| French American Indians | 42.2 /100 | #182 | Average 2.1% |
| Blacks/African Americans | 41.4 /100 | #183 | Average 2.1% |
| Pima | 41.3 /100 | #184 | Average 2.1% |
| Mongolians | 40.8 /100 | #185 | Average 2.1% |
| Immigrants | Bosnia and Herzegovina | 38.6 /100 | #186 | Fair 2.1% |
| Navajo | 36.5 /100 | #187 | Fair 2.1% |
| Immigrants | Kenya | 36.2 /100 | #188 | Fair 2.1% |
| Immigrants | Egypt | 36.1 /100 | #189 | Fair 2.1% |
| Spanish Americans | 32.6 /100 | #190 | Fair 2.1% |
| Bermudans | 30.7 /100 | #191 | Fair 2.1% |
Demographics Similar to Menominee by No Schooling Completed
In terms of no schooling completed, the demographic groups most similar to Menominee are Immigrants from Turkey (1.9%, a difference of 0.25%), Colville (1.9%, a difference of 0.35%), Hmong (1.9%, a difference of 0.40%), Burmese (1.9%, a difference of 0.49%), and Immigrants from Hungary (1.9%, a difference of 0.85%).
| Demographics | Rating | Rank | No Schooling Completed |
| Israelis | 92.4 /100 | #127 | Exceptional 1.9% |
| Spaniards | 92.3 /100 | #128 | Exceptional 1.9% |
| Seminole | 92.0 /100 | #129 | Exceptional 1.9% |
| Palestinians | 91.8 /100 | #130 | Exceptional 1.9% |
| Immigrants | Hungary | 91.6 /100 | #131 | Exceptional 1.9% |
| Colville | 90.4 /100 | #132 | Exceptional 1.9% |
| Immigrants | Turkey | 90.2 /100 | #133 | Exceptional 1.9% |
| Menominee | 89.6 /100 | #134 | Excellent 1.9% |
| Hmong | 88.5 /100 | #135 | Excellent 1.9% |
| Burmese | 88.2 /100 | #136 | Excellent 1.9% |
| Filipinos | 85.5 /100 | #137 | Excellent 2.0% |
| Immigrants | Israel | 85.4 /100 | #138 | Excellent 2.0% |
| Jordanians | 84.5 /100 | #139 | Excellent 2.0% |
| Marshallese | 83.5 /100 | #140 | Excellent 2.0% |
| Immigrants | Greece | 83.5 /100 | #141 | Excellent 2.0% |