Canadian vs Immigrants from Liberia No Schooling Completed
COMPARE
Canadian
Immigrants from Liberia
No Schooling Completed
No Schooling Completed Comparison
Canadians
Immigrants from Liberia
1.7%
NO SCHOOLING COMPLETED
99.7/ 100
METRIC RATING
66th/ 347
METRIC RANK
2.5%
NO SCHOOLING COMPLETED
0.4/ 100
METRIC RATING
263rd/ 347
METRIC RANK
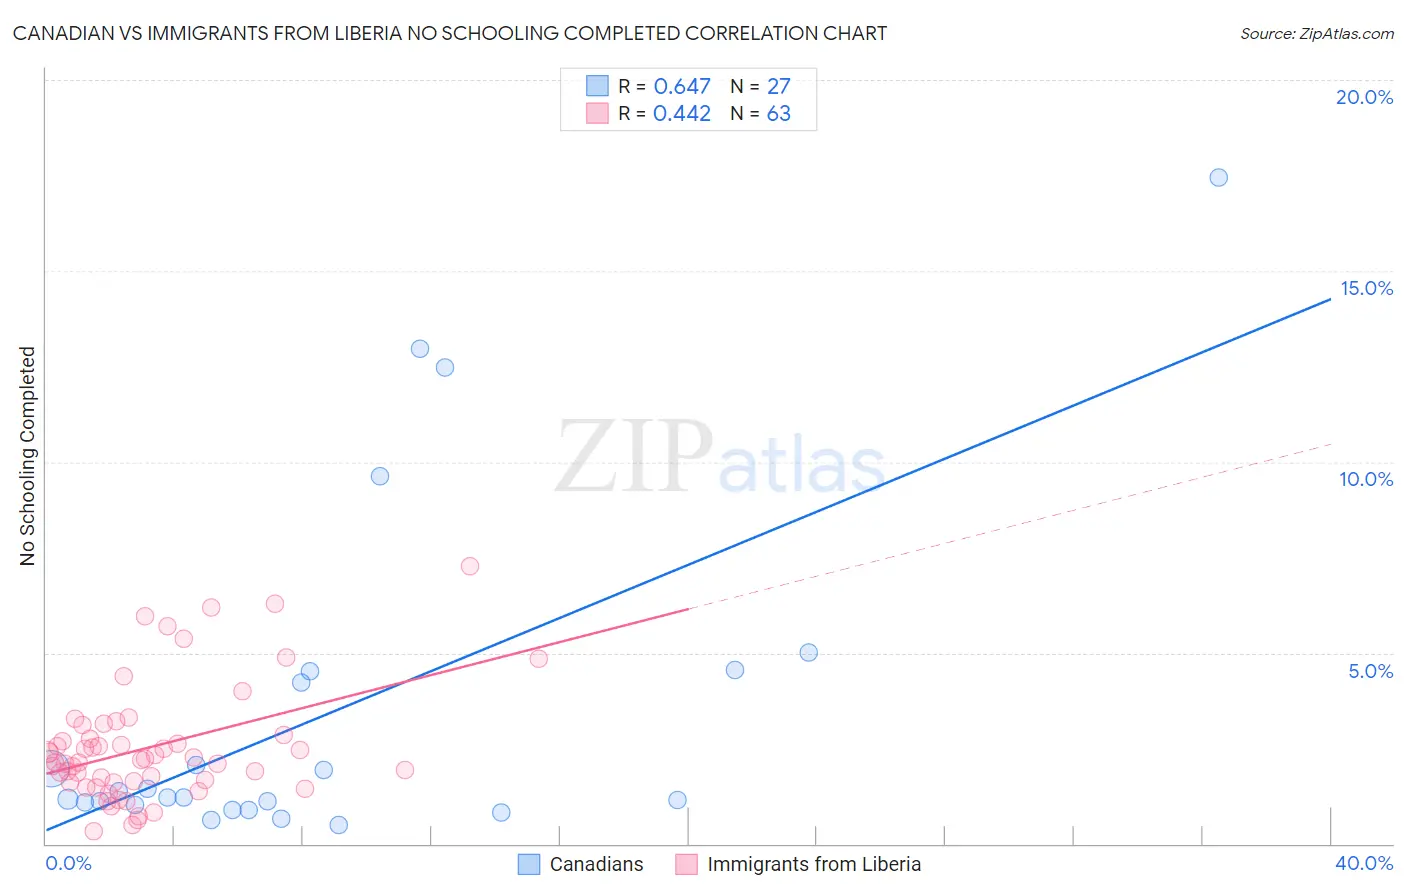
Canadian vs Immigrants from Liberia No Schooling Completed Correlation Chart
The statistical analysis conducted on geographies consisting of 430,389,571 people shows a significant positive correlation between the proportion of Canadians and percentage of population with no schooling in the United States with a correlation coefficient (R) of 0.647 and weighted average of 1.7%. Similarly, the statistical analysis conducted on geographies consisting of 134,971,169 people shows a moderate positive correlation between the proportion of Immigrants from Liberia and percentage of population with no schooling in the United States with a correlation coefficient (R) of 0.442 and weighted average of 2.5%, a difference of 47.6%.
No Schooling Completed Correlation Summary
| Measurement | Canadian | Immigrants from Liberia |
| Minimum | 0.49% | 0.34% |
| Maximum | 17.5% | 7.3% |
| Range | 17.0% | 6.9% |
| Mean | 3.4% | 2.5% |
| Median | 1.2% | 2.2% |
| Interquartile 25% (IQ1) | 1.0% | 1.6% |
| Interquartile 75% (IQ3) | 4.5% | 2.9% |
| Interquartile Range (IQR) | 3.5% | 1.2% |
| Standard Deviation (Sample) | 4.4% | 1.5% |
| Standard Deviation (Population) | 4.4% | 1.5% |
Similar Demographics by No Schooling Completed
Demographics Similar to Canadians by No Schooling Completed
In terms of no schooling completed, the demographic groups most similar to Canadians are Serbian (1.7%, a difference of 0.14%), New Zealander (1.7%, a difference of 0.18%), Immigrants from Austria (1.7%, a difference of 0.19%), Russian (1.7%, a difference of 0.34%), and Immigrants from Northern Europe (1.7%, a difference of 0.38%).
| Demographics | Rating | Rank | No Schooling Completed |
| Slavs | 99.8 /100 | #59 | Exceptional 1.7% |
| Americans | 99.8 /100 | #60 | Exceptional 1.7% |
| Tsimshian | 99.8 /100 | #61 | Exceptional 1.7% |
| Immigrants | Northern Europe | 99.8 /100 | #62 | Exceptional 1.7% |
| Russians | 99.8 /100 | #63 | Exceptional 1.7% |
| New Zealanders | 99.7 /100 | #64 | Exceptional 1.7% |
| Serbians | 99.7 /100 | #65 | Exceptional 1.7% |
| Canadians | 99.7 /100 | #66 | Exceptional 1.7% |
| Immigrants | Austria | 99.7 /100 | #67 | Exceptional 1.7% |
| Immigrants | Lithuania | 99.7 /100 | #68 | Exceptional 1.7% |
| Chickasaw | 99.6 /100 | #69 | Exceptional 1.7% |
| Immigrants | Netherlands | 99.6 /100 | #70 | Exceptional 1.7% |
| Immigrants | England | 99.5 /100 | #71 | Exceptional 1.7% |
| Cajuns | 99.5 /100 | #72 | Exceptional 1.7% |
| Immigrants | India | 99.4 /100 | #73 | Exceptional 1.7% |
Demographics Similar to Immigrants from Liberia by No Schooling Completed
In terms of no schooling completed, the demographic groups most similar to Immigrants from Liberia are Indian (Asian) (2.5%, a difference of 0.13%), Immigrants from Sierra Leone (2.5%, a difference of 0.17%), West Indian (2.5%, a difference of 0.31%), Fijian (2.5%, a difference of 0.39%), and Armenian (2.5%, a difference of 0.52%).
| Demographics | Rating | Rank | No Schooling Completed |
| Yaqui | 0.8 /100 | #256 | Tragic 2.4% |
| Immigrants | South America | 0.6 /100 | #257 | Tragic 2.5% |
| Assyrians/Chaldeans/Syriacs | 0.6 /100 | #258 | Tragic 2.5% |
| Immigrants | Jamaica | 0.6 /100 | #259 | Tragic 2.5% |
| Immigrants | Ethiopia | 0.6 /100 | #260 | Tragic 2.5% |
| Armenians | 0.5 /100 | #261 | Tragic 2.5% |
| Immigrants | Sierra Leone | 0.5 /100 | #262 | Tragic 2.5% |
| Immigrants | Liberia | 0.4 /100 | #263 | Tragic 2.5% |
| Indians (Asian) | 0.4 /100 | #264 | Tragic 2.5% |
| West Indians | 0.4 /100 | #265 | Tragic 2.5% |
| Fijians | 0.4 /100 | #266 | Tragic 2.5% |
| Yuman | 0.4 /100 | #267 | Tragic 2.5% |
| Taiwanese | 0.3 /100 | #268 | Tragic 2.5% |
| Immigrants | Nigeria | 0.2 /100 | #269 | Tragic 2.5% |
| Immigrants | Peru | 0.2 /100 | #270 | Tragic 2.5% |