Pima vs Hawaiian No Schooling Completed
COMPARE
Pima
Hawaiian
No Schooling Completed
No Schooling Completed Comparison
Pima
Hawaiians
2.1%
NO SCHOOLING COMPLETED
41.3/ 100
METRIC RATING
184th/ 347
METRIC RANK
2.2%
NO SCHOOLING COMPLETED
27.0/ 100
METRIC RATING
195th/ 347
METRIC RANK
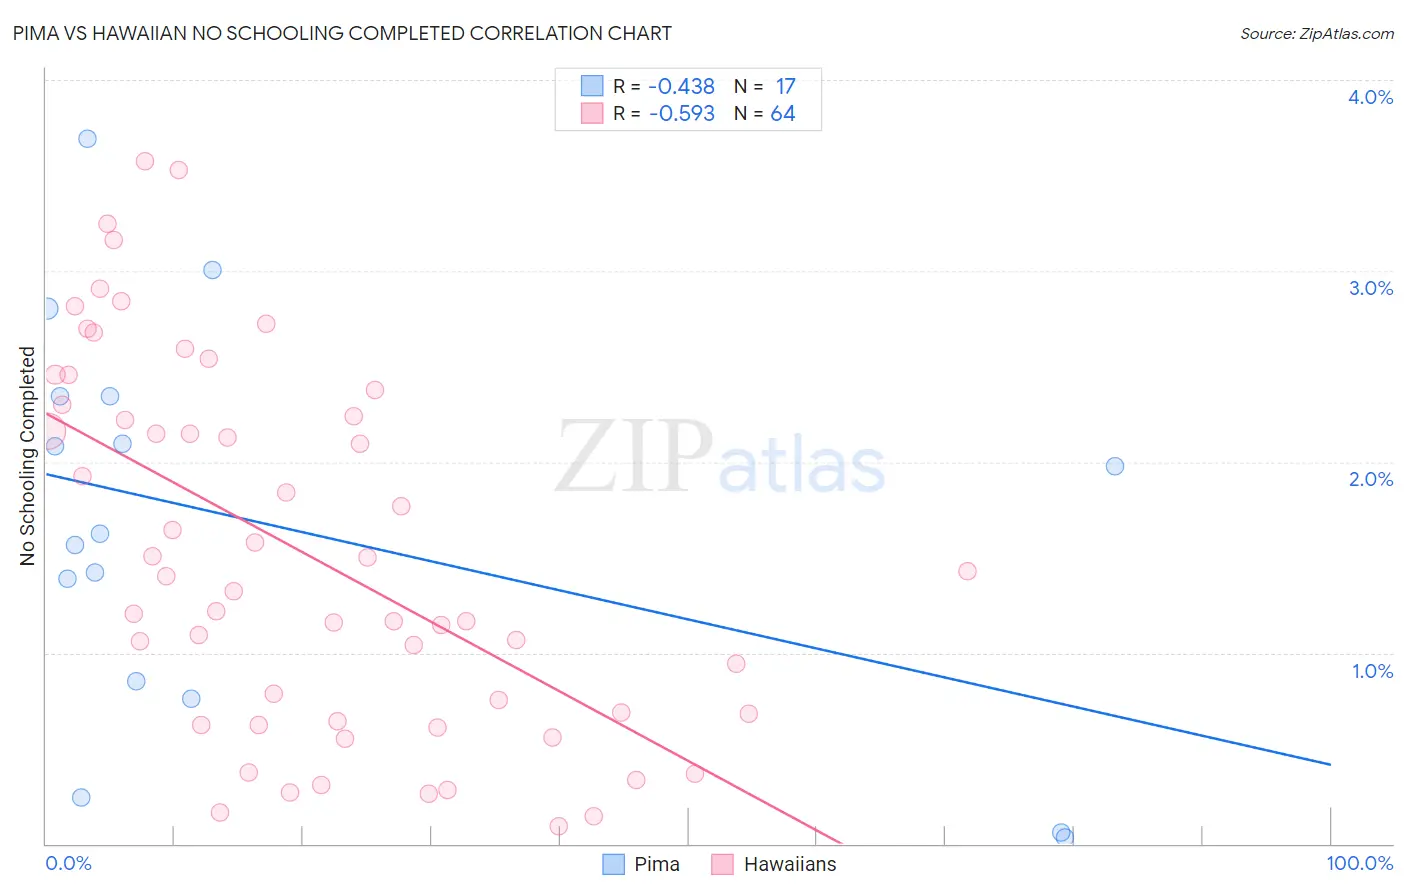
Pima vs Hawaiian No Schooling Completed Correlation Chart
The statistical analysis conducted on geographies consisting of 61,416,926 people shows a moderate negative correlation between the proportion of Pima and percentage of population with no schooling in the United States with a correlation coefficient (R) of -0.438 and weighted average of 2.1%. Similarly, the statistical analysis conducted on geographies consisting of 324,490,486 people shows a substantial negative correlation between the proportion of Hawaiians and percentage of population with no schooling in the United States with a correlation coefficient (R) of -0.593 and weighted average of 2.2%, a difference of 2.1%.
No Schooling Completed Correlation Summary
| Measurement | Pima | Hawaiian |
| Minimum | 0.035% | 0.093% |
| Maximum | 3.7% | 3.6% |
| Range | 3.7% | 3.5% |
| Mean | 1.7% | 1.5% |
| Median | 1.6% | 1.4% |
| Interquartile 25% (IQ1) | 0.80% | 0.66% |
| Interquartile 75% (IQ3) | 2.3% | 2.3% |
| Interquartile Range (IQR) | 1.5% | 1.6% |
| Standard Deviation (Sample) | 1.0% | 0.96% |
| Standard Deviation (Population) | 1.0% | 0.95% |
Demographics Similar to Pima and Hawaiians by No Schooling Completed
In terms of no schooling completed, the demographic groups most similar to Pima are Black/African American (2.1%, a difference of 0.020%), Mongolian (2.1%, a difference of 0.070%), French American Indian (2.1%, a difference of 0.12%), Immigrants from Taiwan (2.1%, a difference of 0.17%), and Portuguese (2.1%, a difference of 0.35%). Similarly, the demographic groups most similar to Hawaiians are Immigrants from Ukraine (2.2%, a difference of 0.15%), Immigrants from Albania (2.2%, a difference of 0.20%), Paraguayan (2.2%, a difference of 0.37%), Guamanian/Chamorro (2.2%, a difference of 0.44%), and Immigrants from Southern Europe (2.2%, a difference of 0.56%).
| Demographics | Rating | Rank | No Schooling Completed |
| Immigrants | Kazakhstan | 44.3 /100 | #179 | Average 2.1% |
| Portuguese | 43.9 /100 | #180 | Average 2.1% |
| Immigrants | Taiwan | 42.6 /100 | #181 | Average 2.1% |
| French American Indians | 42.2 /100 | #182 | Average 2.1% |
| Blacks/African Americans | 41.4 /100 | #183 | Average 2.1% |
| Pima | 41.3 /100 | #184 | Average 2.1% |
| Mongolians | 40.8 /100 | #185 | Average 2.1% |
| Immigrants | Bosnia and Herzegovina | 38.6 /100 | #186 | Fair 2.1% |
| Navajo | 36.5 /100 | #187 | Fair 2.1% |
| Immigrants | Kenya | 36.2 /100 | #188 | Fair 2.1% |
| Immigrants | Egypt | 36.1 /100 | #189 | Fair 2.1% |
| Spanish Americans | 32.6 /100 | #190 | Fair 2.1% |
| Bermudans | 30.7 /100 | #191 | Fair 2.1% |
| Guamanians/Chamorros | 29.8 /100 | #192 | Fair 2.2% |
| Paraguayans | 29.3 /100 | #193 | Fair 2.2% |
| Immigrants | Albania | 28.3 /100 | #194 | Fair 2.2% |
| Hawaiians | 27.0 /100 | #195 | Fair 2.2% |
| Immigrants | Ukraine | 26.1 /100 | #196 | Fair 2.2% |
| Immigrants | Southern Europe | 23.8 /100 | #197 | Fair 2.2% |
| Immigrants | Chile | 22.7 /100 | #198 | Fair 2.2% |
| Africans | 21.8 /100 | #199 | Fair 2.2% |