Burmese vs Immigrants from Liberia No Schooling Completed
COMPARE
Burmese
Immigrants from Liberia
No Schooling Completed
No Schooling Completed Comparison
Burmese
Immigrants from Liberia
1.9%
NO SCHOOLING COMPLETED
88.2/ 100
METRIC RATING
136th/ 347
METRIC RANK
2.5%
NO SCHOOLING COMPLETED
0.4/ 100
METRIC RATING
263rd/ 347
METRIC RANK
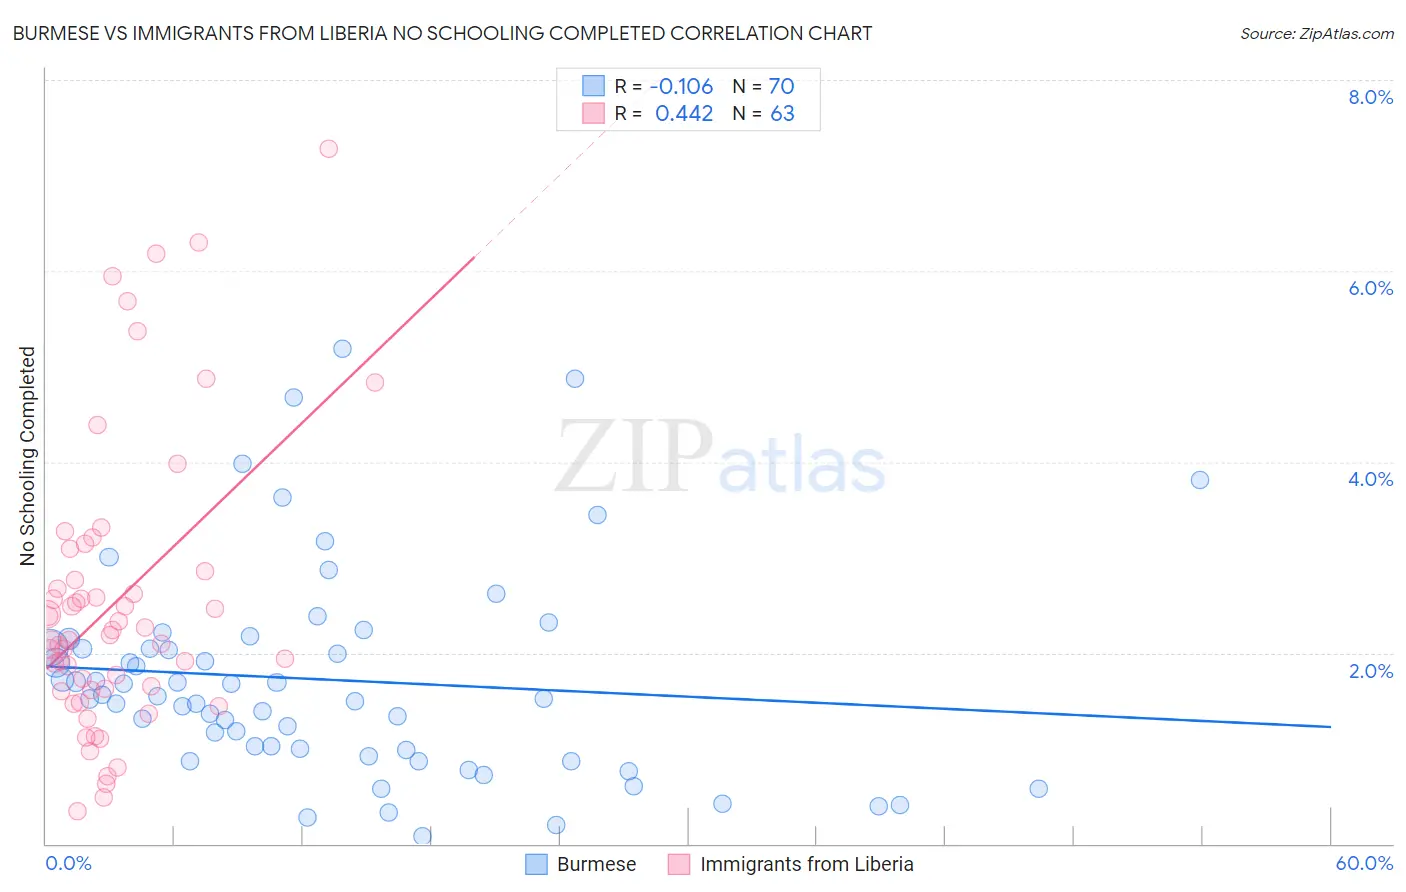
Burmese vs Immigrants from Liberia No Schooling Completed Correlation Chart
The statistical analysis conducted on geographies consisting of 458,309,119 people shows a poor negative correlation between the proportion of Burmese and percentage of population with no schooling in the United States with a correlation coefficient (R) of -0.106 and weighted average of 1.9%. Similarly, the statistical analysis conducted on geographies consisting of 134,971,169 people shows a moderate positive correlation between the proportion of Immigrants from Liberia and percentage of population with no schooling in the United States with a correlation coefficient (R) of 0.442 and weighted average of 2.5%, a difference of 26.8%.
No Schooling Completed Correlation Summary
| Measurement | Burmese | Immigrants from Liberia |
| Minimum | 0.081% | 0.34% |
| Maximum | 5.2% | 7.3% |
| Range | 5.1% | 6.9% |
| Mean | 1.7% | 2.5% |
| Median | 1.5% | 2.2% |
| Interquartile 25% (IQ1) | 0.98% | 1.6% |
| Interquartile 75% (IQ3) | 2.1% | 2.9% |
| Interquartile Range (IQR) | 1.1% | 1.2% |
| Standard Deviation (Sample) | 1.1% | 1.5% |
| Standard Deviation (Population) | 1.1% | 1.5% |
Similar Demographics by No Schooling Completed
Demographics Similar to Burmese by No Schooling Completed
In terms of no schooling completed, the demographic groups most similar to Burmese are Hmong (1.9%, a difference of 0.090%), Menominee (1.9%, a difference of 0.49%), Immigrants from Turkey (1.9%, a difference of 0.74%), Colville (1.9%, a difference of 0.84%), and Filipino (2.0%, a difference of 0.86%).
| Demographics | Rating | Rank | No Schooling Completed |
| Seminole | 92.0 /100 | #129 | Exceptional 1.9% |
| Palestinians | 91.8 /100 | #130 | Exceptional 1.9% |
| Immigrants | Hungary | 91.6 /100 | #131 | Exceptional 1.9% |
| Colville | 90.4 /100 | #132 | Exceptional 1.9% |
| Immigrants | Turkey | 90.2 /100 | #133 | Exceptional 1.9% |
| Menominee | 89.6 /100 | #134 | Excellent 1.9% |
| Hmong | 88.5 /100 | #135 | Excellent 1.9% |
| Burmese | 88.2 /100 | #136 | Excellent 1.9% |
| Filipinos | 85.5 /100 | #137 | Excellent 2.0% |
| Immigrants | Israel | 85.4 /100 | #138 | Excellent 2.0% |
| Jordanians | 84.5 /100 | #139 | Excellent 2.0% |
| Marshallese | 83.5 /100 | #140 | Excellent 2.0% |
| Immigrants | Greece | 83.5 /100 | #141 | Excellent 2.0% |
| Venezuelans | 81.5 /100 | #142 | Excellent 2.0% |
| Immigrants | South Central Asia | 80.0 /100 | #143 | Good 2.0% |
Demographics Similar to Immigrants from Liberia by No Schooling Completed
In terms of no schooling completed, the demographic groups most similar to Immigrants from Liberia are Indian (Asian) (2.5%, a difference of 0.13%), Immigrants from Sierra Leone (2.5%, a difference of 0.17%), West Indian (2.5%, a difference of 0.31%), Fijian (2.5%, a difference of 0.39%), and Armenian (2.5%, a difference of 0.52%).
| Demographics | Rating | Rank | No Schooling Completed |
| Yaqui | 0.8 /100 | #256 | Tragic 2.4% |
| Immigrants | South America | 0.6 /100 | #257 | Tragic 2.5% |
| Assyrians/Chaldeans/Syriacs | 0.6 /100 | #258 | Tragic 2.5% |
| Immigrants | Jamaica | 0.6 /100 | #259 | Tragic 2.5% |
| Immigrants | Ethiopia | 0.6 /100 | #260 | Tragic 2.5% |
| Armenians | 0.5 /100 | #261 | Tragic 2.5% |
| Immigrants | Sierra Leone | 0.5 /100 | #262 | Tragic 2.5% |
| Immigrants | Liberia | 0.4 /100 | #263 | Tragic 2.5% |
| Indians (Asian) | 0.4 /100 | #264 | Tragic 2.5% |
| West Indians | 0.4 /100 | #265 | Tragic 2.5% |
| Fijians | 0.4 /100 | #266 | Tragic 2.5% |
| Yuman | 0.4 /100 | #267 | Tragic 2.5% |
| Taiwanese | 0.3 /100 | #268 | Tragic 2.5% |
| Immigrants | Nigeria | 0.2 /100 | #269 | Tragic 2.5% |
| Immigrants | Peru | 0.2 /100 | #270 | Tragic 2.5% |