Immigrants from Latin America vs Immigrants from Haiti No Schooling Completed
COMPARE
Immigrants from Latin America
Immigrants from Haiti
No Schooling Completed
No Schooling Completed Comparison
Immigrants from Latin America
Immigrants from Haiti
3.3%
NO SCHOOLING COMPLETED
0.0/ 100
METRIC RATING
327th/ 347
METRIC RANK
3.0%
NO SCHOOLING COMPLETED
0.0/ 100
METRIC RATING
307th/ 347
METRIC RANK
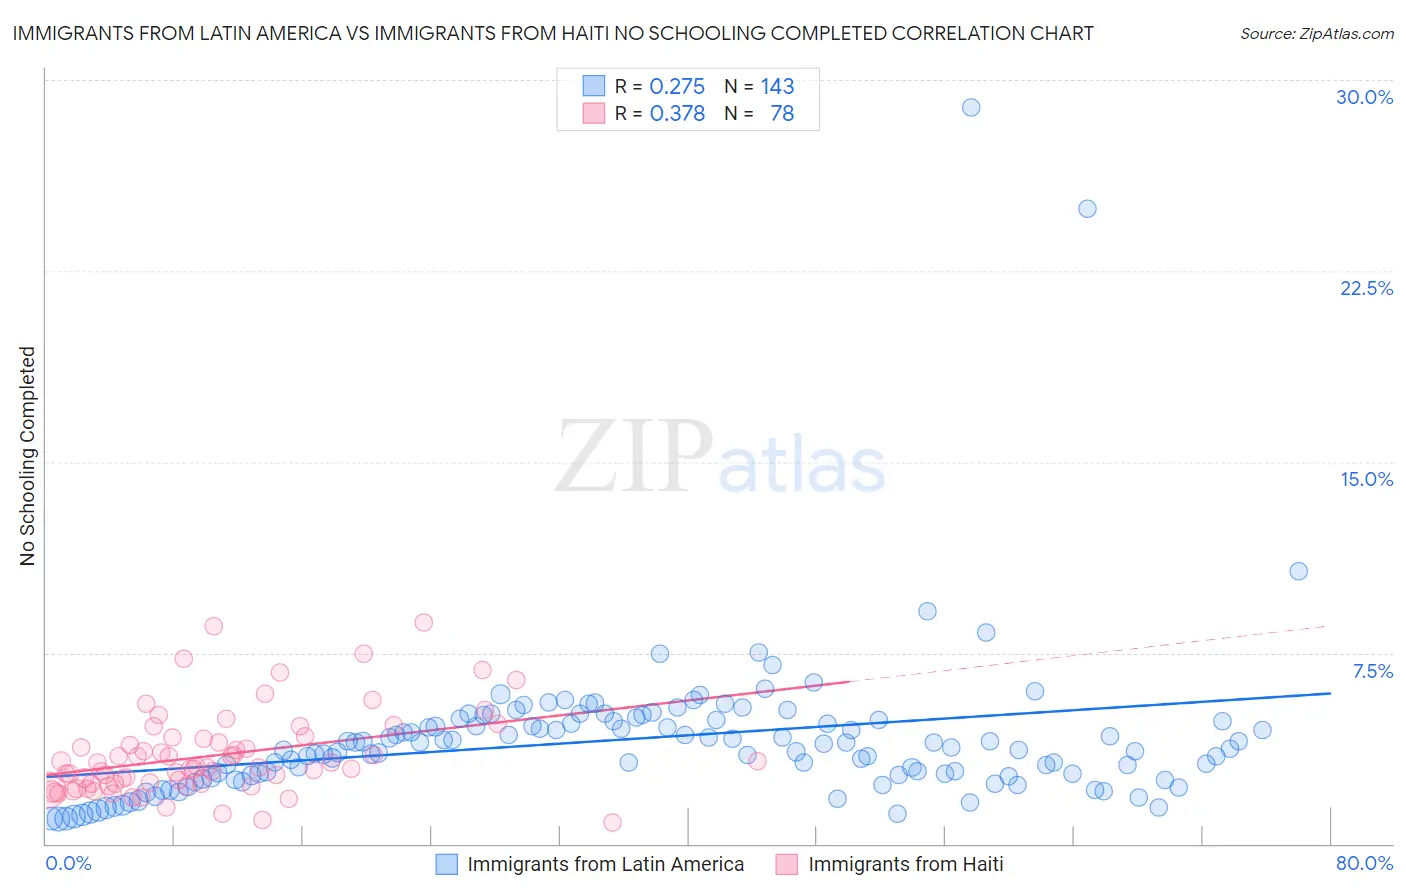
Immigrants from Latin America vs Immigrants from Haiti No Schooling Completed Correlation Chart
The statistical analysis conducted on geographies consisting of 544,626,329 people shows a weak positive correlation between the proportion of Immigrants from Latin America and percentage of population with no schooling in the United States with a correlation coefficient (R) of 0.275 and weighted average of 3.3%. Similarly, the statistical analysis conducted on geographies consisting of 224,149,714 people shows a mild positive correlation between the proportion of Immigrants from Haiti and percentage of population with no schooling in the United States with a correlation coefficient (R) of 0.378 and weighted average of 3.0%, a difference of 9.4%.
No Schooling Completed Correlation Summary
| Measurement | Immigrants from Latin America | Immigrants from Haiti |
| Minimum | 0.98% | 0.82% |
| Maximum | 28.9% | 8.7% |
| Range | 27.9% | 7.9% |
| Mean | 4.1% | 3.5% |
| Median | 3.7% | 3.0% |
| Interquartile 25% (IQ1) | 2.7% | 2.3% |
| Interquartile 75% (IQ3) | 4.8% | 4.1% |
| Interquartile Range (IQR) | 2.2% | 1.8% |
| Standard Deviation (Sample) | 3.2% | 1.7% |
| Standard Deviation (Population) | 3.2% | 1.6% |
Demographics Similar to Immigrants from Latin America and Immigrants from Haiti by No Schooling Completed
In terms of no schooling completed, the demographic groups most similar to Immigrants from Latin America are Indonesian (3.2%, a difference of 2.5%), Dominican (3.2%, a difference of 2.5%), Mexican American Indian (3.2%, a difference of 3.2%), Vietnamese (3.2%, a difference of 3.5%), and Immigrants from Honduras (3.2%, a difference of 3.7%). Similarly, the demographic groups most similar to Immigrants from Haiti are Immigrants from Somalia (3.0%, a difference of 0.16%), Hispanic or Latino (3.0%, a difference of 0.97%), Guyanese (3.0%, a difference of 1.0%), Immigrants from the Azores (3.0%, a difference of 1.1%), and Sri Lankan (3.0%, a difference of 1.4%).
| Demographics | Rating | Rank | No Schooling Completed |
| Immigrants | Haiti | 0.0 /100 | #307 | Tragic 3.0% |
| Immigrants | Somalia | 0.0 /100 | #308 | Tragic 3.0% |
| Hispanics or Latinos | 0.0 /100 | #309 | Tragic 3.0% |
| Guyanese | 0.0 /100 | #310 | Tragic 3.0% |
| Immigrants | Azores | 0.0 /100 | #311 | Tragic 3.0% |
| Sri Lankans | 0.0 /100 | #312 | Tragic 3.0% |
| Hondurans | 0.0 /100 | #313 | Tragic 3.1% |
| Immigrants | Belize | 0.0 /100 | #314 | Tragic 3.1% |
| Immigrants | Nicaragua | 0.0 /100 | #315 | Tragic 3.1% |
| Immigrants | Ecuador | 0.0 /100 | #316 | Tragic 3.1% |
| Cape Verdeans | 0.0 /100 | #317 | Tragic 3.1% |
| Immigrants | Guyana | 0.0 /100 | #318 | Tragic 3.1% |
| Immigrants | Burma/Myanmar | 0.0 /100 | #319 | Tragic 3.1% |
| Immigrants | Bangladesh | 0.0 /100 | #320 | Tragic 3.1% |
| Immigrants | Laos | 0.0 /100 | #321 | Tragic 3.1% |
| Immigrants | Honduras | 0.0 /100 | #322 | Tragic 3.2% |
| Vietnamese | 0.0 /100 | #323 | Tragic 3.2% |
| Mexican American Indians | 0.0 /100 | #324 | Tragic 3.2% |
| Dominicans | 0.0 /100 | #325 | Tragic 3.2% |
| Indonesians | 0.0 /100 | #326 | Tragic 3.2% |
| Immigrants | Latin America | 0.0 /100 | #327 | Tragic 3.3% |