Immigrants from Thailand vs Immigrants from Haiti No Schooling Completed
COMPARE
Immigrants from Thailand
Immigrants from Haiti
No Schooling Completed
No Schooling Completed Comparison
Immigrants from Thailand
Immigrants from Haiti
2.7%
NO SCHOOLING COMPLETED
0.0/ 100
METRIC RATING
289th/ 347
METRIC RANK
3.0%
NO SCHOOLING COMPLETED
0.0/ 100
METRIC RATING
307th/ 347
METRIC RANK
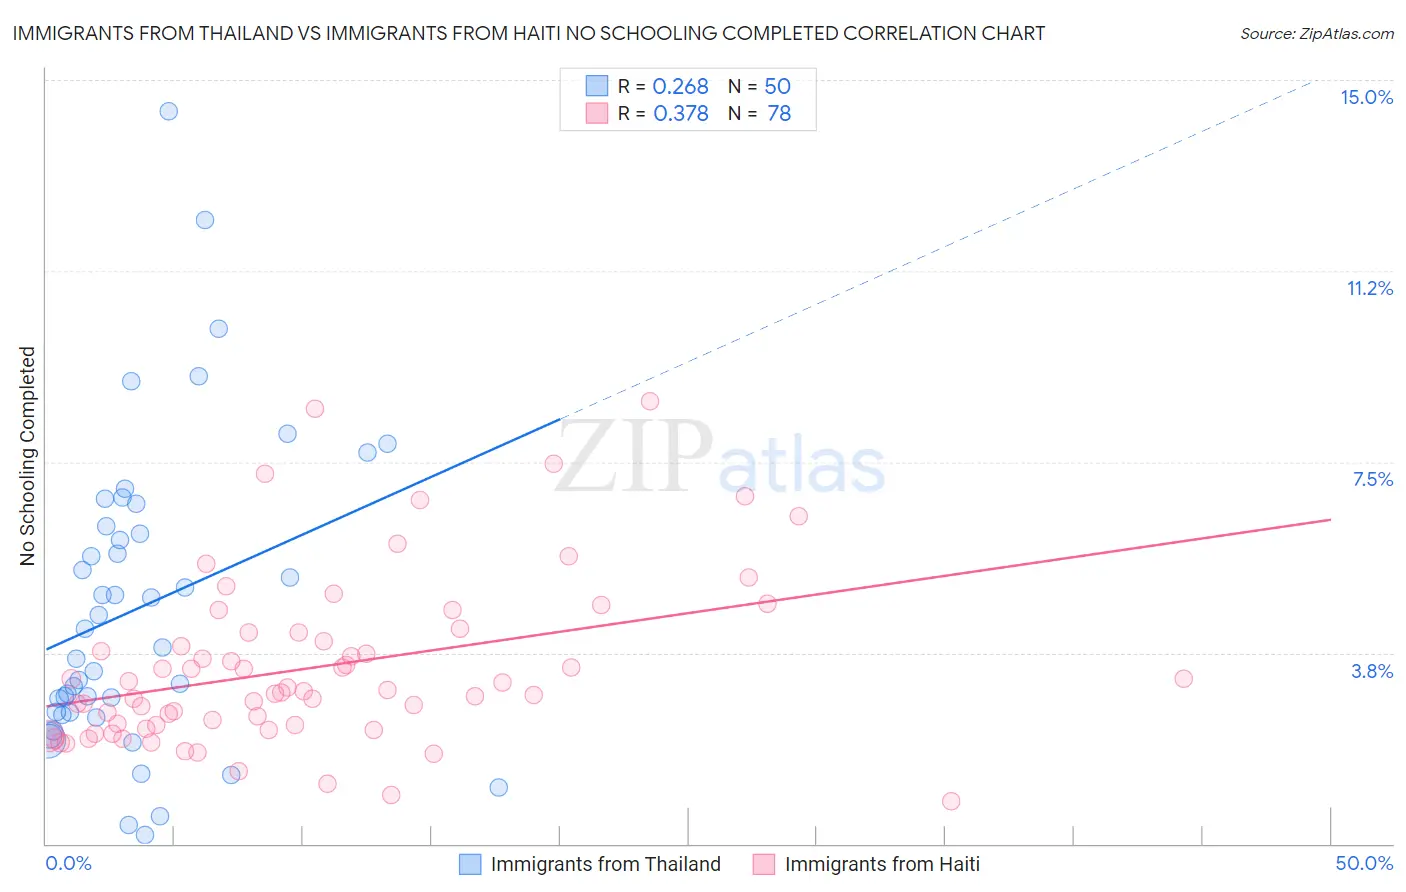
Immigrants from Thailand vs Immigrants from Haiti No Schooling Completed Correlation Chart
The statistical analysis conducted on geographies consisting of 315,042,408 people shows a weak positive correlation between the proportion of Immigrants from Thailand and percentage of population with no schooling in the United States with a correlation coefficient (R) of 0.268 and weighted average of 2.7%. Similarly, the statistical analysis conducted on geographies consisting of 224,149,714 people shows a mild positive correlation between the proportion of Immigrants from Haiti and percentage of population with no schooling in the United States with a correlation coefficient (R) of 0.378 and weighted average of 3.0%, a difference of 11.3%.
No Schooling Completed Correlation Summary
| Measurement | Immigrants from Thailand | Immigrants from Haiti |
| Minimum | 0.18% | 0.82% |
| Maximum | 14.4% | 8.7% |
| Range | 14.2% | 7.9% |
| Mean | 4.7% | 3.5% |
| Median | 4.0% | 3.0% |
| Interquartile 25% (IQ1) | 2.6% | 2.3% |
| Interquartile 75% (IQ3) | 6.2% | 4.1% |
| Interquartile Range (IQR) | 3.6% | 1.8% |
| Standard Deviation (Sample) | 3.0% | 1.7% |
| Standard Deviation (Population) | 3.0% | 1.6% |
Demographics Similar to Immigrants from Thailand and Immigrants from Haiti by No Schooling Completed
In terms of no schooling completed, the demographic groups most similar to Immigrants from Thailand are Immigrants from Hong Kong (2.7%, a difference of 0.060%), Immigrants from St. Vincent and the Grenadines (2.7%, a difference of 0.32%), British West Indian (2.7%, a difference of 0.95%), Immigrants from Grenada (2.8%, a difference of 2.0%), and Malaysian (2.8%, a difference of 2.4%). Similarly, the demographic groups most similar to Immigrants from Haiti are Belizean (3.0%, a difference of 0.080%), Immigrants from Somalia (3.0%, a difference of 0.16%), Ecuadorian (3.0%, a difference of 1.7%), Nicaraguan (2.9%, a difference of 2.2%), and Somali (2.9%, a difference of 2.4%).
| Demographics | Rating | Rank | No Schooling Completed |
| Immigrants | St. Vincent and the Grenadines | 0.0 /100 | #288 | Tragic 2.7% |
| Immigrants | Thailand | 0.0 /100 | #289 | Tragic 2.7% |
| Immigrants | Hong Kong | 0.0 /100 | #290 | Tragic 2.7% |
| British West Indians | 0.0 /100 | #291 | Tragic 2.7% |
| Immigrants | Grenada | 0.0 /100 | #292 | Tragic 2.8% |
| Malaysians | 0.0 /100 | #293 | Tragic 2.8% |
| Immigrants | Eritrea | 0.0 /100 | #294 | Tragic 2.8% |
| Houma | 0.0 /100 | #295 | Tragic 2.8% |
| Immigrants | Immigrants | 0.0 /100 | #296 | Tragic 2.8% |
| Immigrants | Cuba | 0.0 /100 | #297 | Tragic 2.8% |
| Immigrants | Dominica | 0.0 /100 | #298 | Tragic 2.8% |
| Central American Indians | 0.0 /100 | #299 | Tragic 2.8% |
| Haitians | 0.0 /100 | #300 | Tragic 2.9% |
| Immigrants | South Eastern Asia | 0.0 /100 | #301 | Tragic 2.9% |
| Immigrants | Caribbean | 0.0 /100 | #302 | Tragic 2.9% |
| Somalis | 0.0 /100 | #303 | Tragic 2.9% |
| Nicaraguans | 0.0 /100 | #304 | Tragic 2.9% |
| Ecuadorians | 0.0 /100 | #305 | Tragic 3.0% |
| Belizeans | 0.0 /100 | #306 | Tragic 3.0% |
| Immigrants | Haiti | 0.0 /100 | #307 | Tragic 3.0% |
| Immigrants | Somalia | 0.0 /100 | #308 | Tragic 3.0% |