Pima vs Immigrants from Haiti Householder Income Ages 25 - 44 years
COMPARE
Pima
Immigrants from Haiti
Householder Income Ages 25 - 44 years
Householder Income Ages 25 - 44 years Comparison
Pima
Immigrants from Haiti
$82,821
HOUSEHOLDER INCOME AGES 25 - 44 YEARS
0.1/ 100
METRIC RATING
279th/ 347
METRIC RANK
$79,391
HOUSEHOLDER INCOME AGES 25 - 44 YEARS
0.0/ 100
METRIC RATING
312th/ 347
METRIC RANK
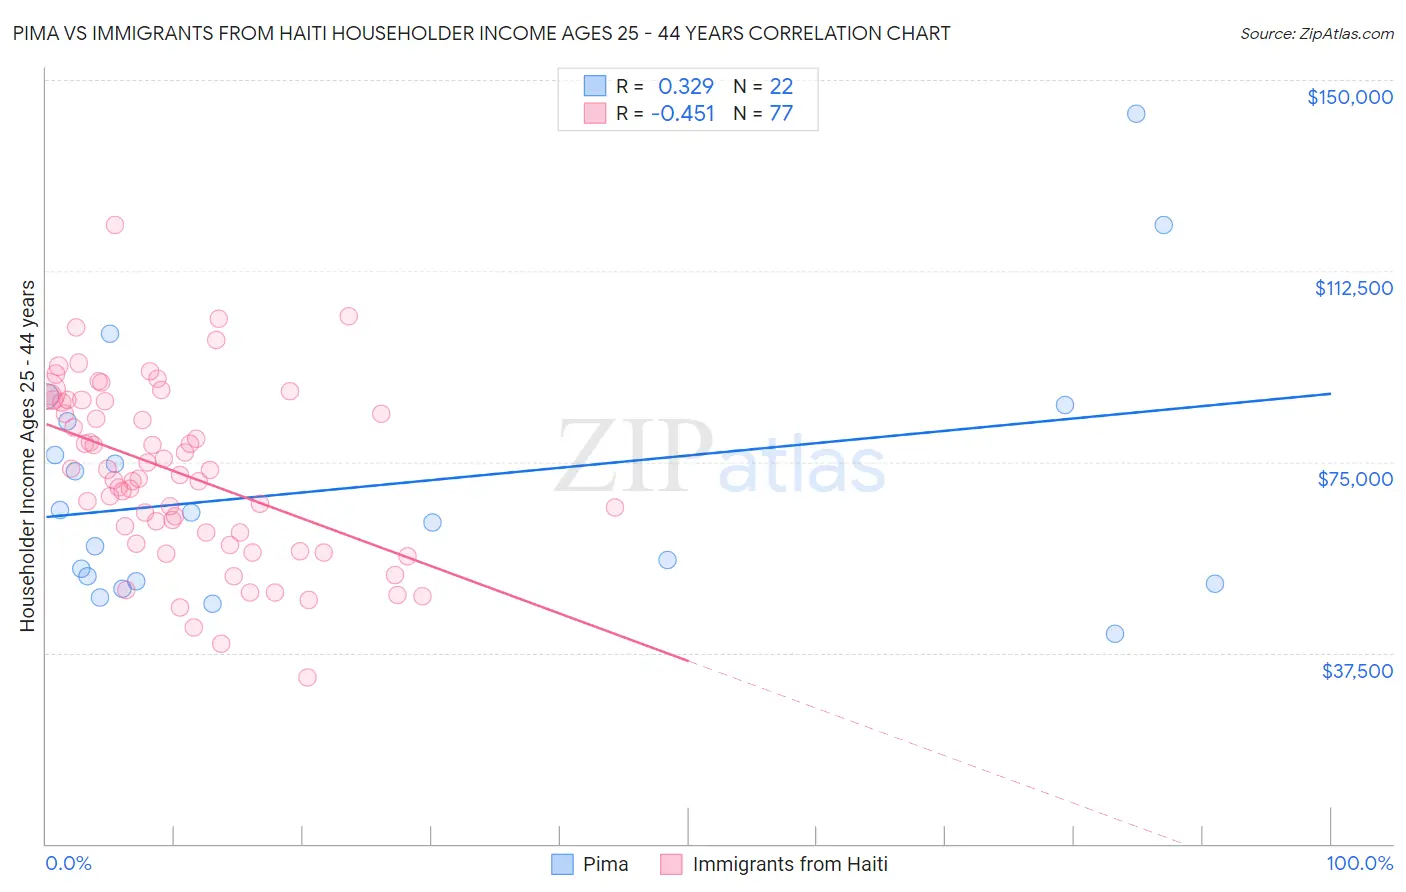
Pima vs Immigrants from Haiti Householder Income Ages 25 - 44 years Correlation Chart
The statistical analysis conducted on geographies consisting of 61,441,839 people shows a mild positive correlation between the proportion of Pima and household income with householder between the ages 25 and 44 in the United States with a correlation coefficient (R) of 0.329 and weighted average of $82,821. Similarly, the statistical analysis conducted on geographies consisting of 224,831,878 people shows a moderate negative correlation between the proportion of Immigrants from Haiti and household income with householder between the ages 25 and 44 in the United States with a correlation coefficient (R) of -0.451 and weighted average of $79,391, a difference of 4.3%.
Householder Income Ages 25 - 44 years Correlation Summary
| Measurement | Pima | Immigrants from Haiti |
| Minimum | $41,167 | $32,753 |
| Maximum | $143,258 | $121,599 |
| Range | $102,091 | $88,846 |
| Mean | $70,457 | $72,834 |
| Median | $64,038 | $72,419 |
| Interquartile 25% (IQ1) | $51,500 | $60,083 |
| Interquartile 75% (IQ3) | $82,898 | $86,997 |
| Interquartile Range (IQR) | $31,398 | $26,914 |
| Standard Deviation (Sample) | $25,507 | $17,154 |
| Standard Deviation (Population) | $24,921 | $17,042 |
Similar Demographics by Householder Income Ages 25 - 44 years
Demographics Similar to Pima by Householder Income Ages 25 - 44 years
In terms of householder income ages 25 - 44 years, the demographic groups most similar to Pima are Senegalese ($82,852, a difference of 0.040%), Paiute ($82,984, a difference of 0.20%), Colville ($82,604, a difference of 0.26%), Immigrants from Belize ($83,141, a difference of 0.39%), and Cajun ($82,393, a difference of 0.52%).
| Demographics | Rating | Rank | Householder Income Ages 25 - 44 years |
| Spanish Americans | 0.2 /100 | #272 | Tragic $83,722 |
| Iroquois | 0.2 /100 | #273 | Tragic $83,682 |
| Marshallese | 0.2 /100 | #274 | Tragic $83,575 |
| Immigrants | Jamaica | 0.2 /100 | #275 | Tragic $83,298 |
| Immigrants | Belize | 0.2 /100 | #276 | Tragic $83,141 |
| Paiute | 0.2 /100 | #277 | Tragic $82,984 |
| Senegalese | 0.2 /100 | #278 | Tragic $82,852 |
| Pima | 0.1 /100 | #279 | Tragic $82,821 |
| Colville | 0.1 /100 | #280 | Tragic $82,604 |
| Cajuns | 0.1 /100 | #281 | Tragic $82,393 |
| Central American Indians | 0.1 /100 | #282 | Tragic $82,355 |
| Guatemalans | 0.1 /100 | #283 | Tragic $82,331 |
| Immigrants | Middle Africa | 0.1 /100 | #284 | Tragic $82,254 |
| Immigrants | Somalia | 0.1 /100 | #285 | Tragic $82,188 |
| Ute | 0.1 /100 | #286 | Tragic $82,166 |
Demographics Similar to Immigrants from Haiti by Householder Income Ages 25 - 44 years
In terms of householder income ages 25 - 44 years, the demographic groups most similar to Immigrants from Haiti are Menominee ($79,358, a difference of 0.040%), Indonesian ($79,543, a difference of 0.19%), Cheyenne ($79,152, a difference of 0.30%), Ottawa ($79,012, a difference of 0.48%), and African ($78,986, a difference of 0.51%).
| Demographics | Rating | Rank | Householder Income Ages 25 - 44 years |
| Immigrants | Dominican Republic | 0.0 /100 | #305 | Tragic $80,319 |
| Apache | 0.0 /100 | #306 | Tragic $80,260 |
| Haitians | 0.0 /100 | #307 | Tragic $80,055 |
| Immigrants | Central America | 0.0 /100 | #308 | Tragic $80,012 |
| Chippewa | 0.0 /100 | #309 | Tragic $80,005 |
| Fijians | 0.0 /100 | #310 | Tragic $79,956 |
| Indonesians | 0.0 /100 | #311 | Tragic $79,543 |
| Immigrants | Haiti | 0.0 /100 | #312 | Tragic $79,391 |
| Menominee | 0.0 /100 | #313 | Tragic $79,358 |
| Cheyenne | 0.0 /100 | #314 | Tragic $79,152 |
| Ottawa | 0.0 /100 | #315 | Tragic $79,012 |
| Africans | 0.0 /100 | #316 | Tragic $78,986 |
| U.S. Virgin Islanders | 0.0 /100 | #317 | Tragic $78,911 |
| Immigrants | Mexico | 0.0 /100 | #318 | Tragic $78,809 |
| Hondurans | 0.0 /100 | #319 | Tragic $78,540 |