Chippewa vs Bermudan 10th Grade
COMPARE
Chippewa
Bermudan
10th Grade
10th Grade Comparison
Chippewa
Bermudans
95.0%
10TH GRADE
99.8/ 100
METRIC RATING
61st/ 347
METRIC RANK
93.9%
10TH GRADE
71.0/ 100
METRIC RATING
158th/ 347
METRIC RANK
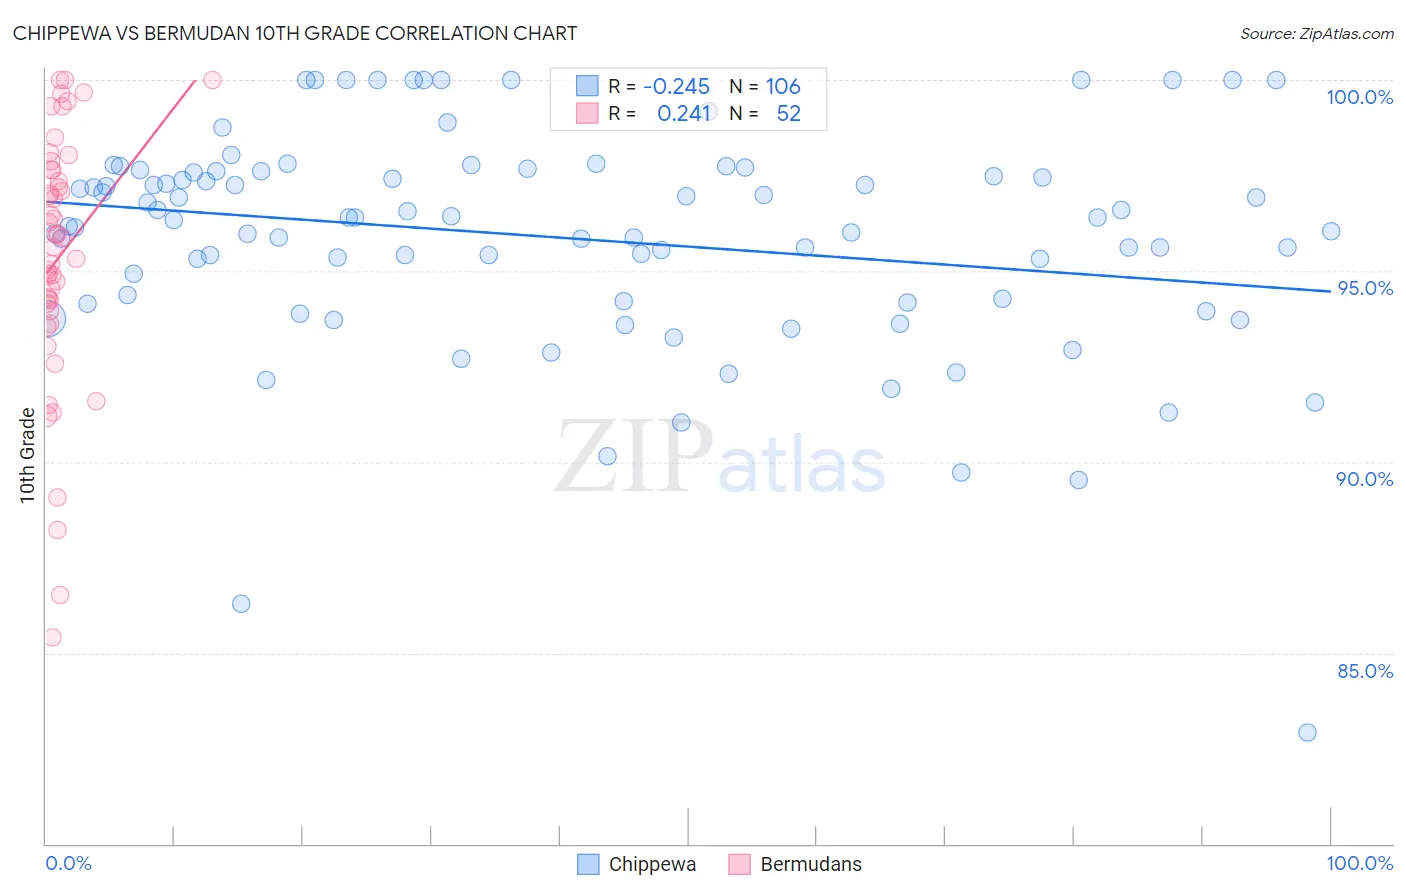
Chippewa vs Bermudan 10th Grade Correlation Chart
The statistical analysis conducted on geographies consisting of 215,067,289 people shows a weak negative correlation between the proportion of Chippewa and percentage of population with at least 10th grade education in the United States with a correlation coefficient (R) of -0.245 and weighted average of 95.0%. Similarly, the statistical analysis conducted on geographies consisting of 55,730,379 people shows a weak positive correlation between the proportion of Bermudans and percentage of population with at least 10th grade education in the United States with a correlation coefficient (R) of 0.241 and weighted average of 93.9%, a difference of 1.1%.
10th Grade Correlation Summary
| Measurement | Chippewa | Bermudan |
| Minimum | 82.9% | 85.4% |
| Maximum | 100.0% | 100.0% |
| Range | 17.1% | 14.6% |
| Mean | 95.9% | 95.3% |
| Median | 96.4% | 95.8% |
| Interquartile 25% (IQ1) | 94.2% | 94.0% |
| Interquartile 75% (IQ3) | 97.6% | 97.7% |
| Interquartile Range (IQR) | 3.4% | 3.6% |
| Standard Deviation (Sample) | 2.9% | 3.4% |
| Standard Deviation (Population) | 2.9% | 3.3% |
Similar Demographics by 10th Grade
Demographics Similar to Chippewa by 10th Grade
In terms of 10th grade, the demographic groups most similar to Chippewa are Cypriot (95.0%, a difference of 0.0%), Aleut (95.0%, a difference of 0.010%), Celtic (95.0%, a difference of 0.010%), Thai (95.0%, a difference of 0.010%), and Immigrants from Singapore (95.0%, a difference of 0.010%).
| Demographics | Rating | Rank | 10th Grade |
| Immigrants | Lithuania | 99.8 /100 | #54 | Exceptional 95.0% |
| Immigrants | Ireland | 99.8 /100 | #55 | Exceptional 95.0% |
| New Zealanders | 99.8 /100 | #56 | Exceptional 95.0% |
| Ukrainians | 99.8 /100 | #57 | Exceptional 95.0% |
| Aleuts | 99.8 /100 | #58 | Exceptional 95.0% |
| Celtics | 99.8 /100 | #59 | Exceptional 95.0% |
| Cypriots | 99.8 /100 | #60 | Exceptional 95.0% |
| Chippewa | 99.8 /100 | #61 | Exceptional 95.0% |
| Thais | 99.8 /100 | #62 | Exceptional 95.0% |
| Immigrants | Singapore | 99.8 /100 | #63 | Exceptional 95.0% |
| Native Hawaiians | 99.7 /100 | #64 | Exceptional 95.0% |
| Turks | 99.7 /100 | #65 | Exceptional 95.0% |
| Immigrants | Australia | 99.7 /100 | #66 | Exceptional 94.9% |
| Immigrants | Netherlands | 99.7 /100 | #67 | Exceptional 94.9% |
| Immigrants | Belgium | 99.7 /100 | #68 | Exceptional 94.9% |
Demographics Similar to Bermudans by 10th Grade
In terms of 10th grade, the demographic groups most similar to Bermudans are Chilean (93.9%, a difference of 0.010%), Pakistani (93.9%, a difference of 0.010%), Assyrian/Chaldean/Syriac (93.9%, a difference of 0.010%), Immigrants from Poland (93.9%, a difference of 0.020%), and Venezuelan (93.9%, a difference of 0.020%).
| Demographics | Rating | Rank | 10th Grade |
| Kenyans | 79.1 /100 | #151 | Good 94.0% |
| Immigrants | Italy | 78.0 /100 | #152 | Good 94.0% |
| Immigrants | Brazil | 75.5 /100 | #153 | Good 94.0% |
| Immigrants | Kenya | 75.3 /100 | #154 | Good 94.0% |
| Spanish | 74.9 /100 | #155 | Good 94.0% |
| Mongolians | 74.4 /100 | #156 | Good 94.0% |
| Kiowa | 73.3 /100 | #157 | Good 93.9% |
| Bermudans | 71.0 /100 | #158 | Good 93.9% |
| Chileans | 70.2 /100 | #159 | Good 93.9% |
| Pakistanis | 70.1 /100 | #160 | Good 93.9% |
| Assyrians/Chaldeans/Syriacs | 69.7 /100 | #161 | Good 93.9% |
| Immigrants | Poland | 69.6 /100 | #162 | Good 93.9% |
| Venezuelans | 69.5 /100 | #163 | Good 93.9% |
| Iraqis | 68.1 /100 | #164 | Good 93.9% |
| Brazilians | 63.6 /100 | #165 | Good 93.8% |