Yup'ik vs Bermudan 10th Grade
COMPARE
Yup'ik
Bermudan
10th Grade
10th Grade Comparison
Yup'ik
Bermudans
93.6%
10TH GRADE
31.1/ 100
METRIC RATING
191st/ 347
METRIC RANK
93.9%
10TH GRADE
71.0/ 100
METRIC RATING
158th/ 347
METRIC RANK
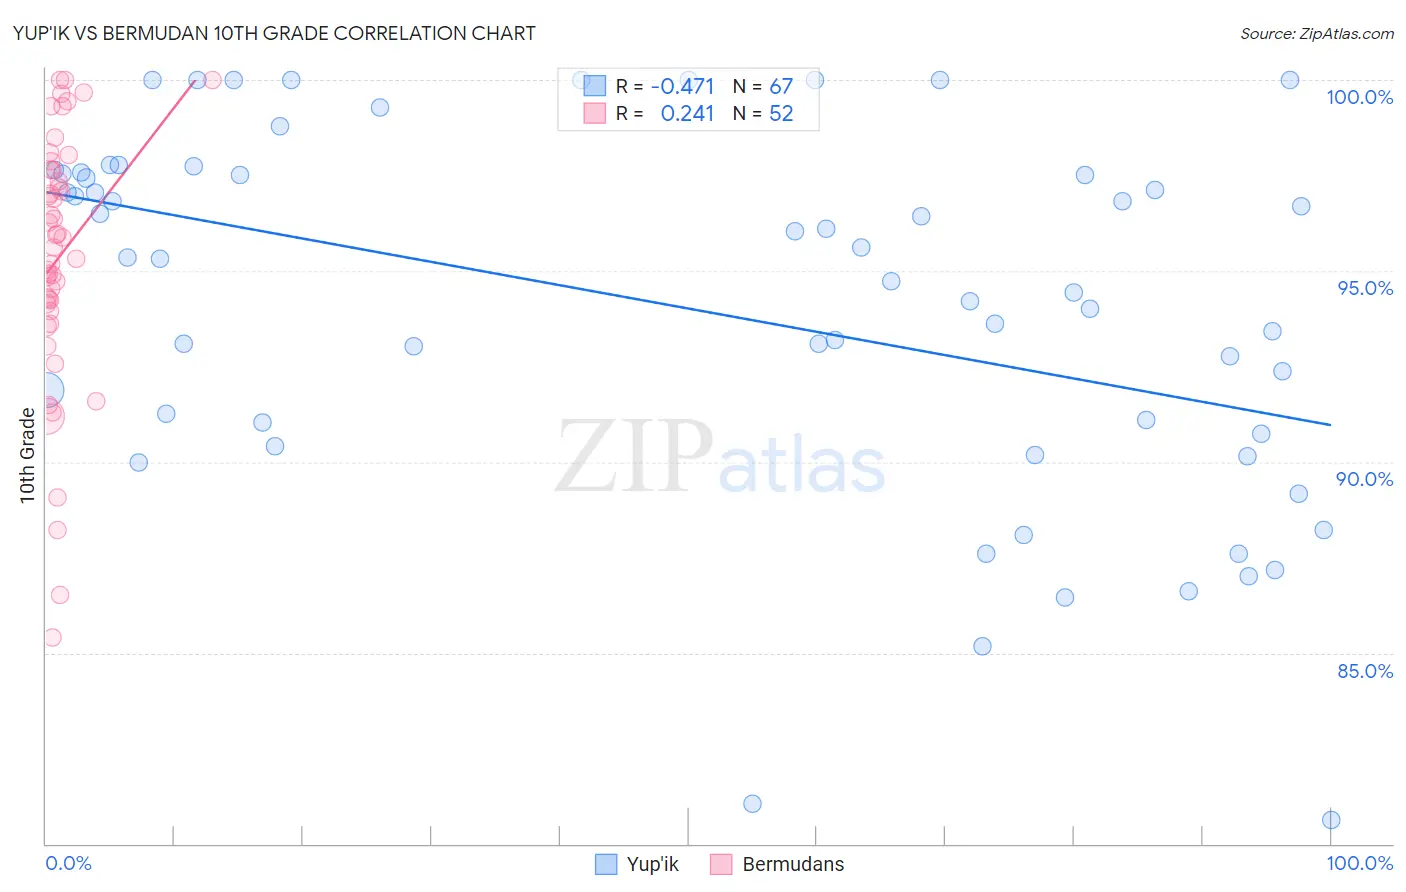
Yup'ik vs Bermudan 10th Grade Correlation Chart
The statistical analysis conducted on geographies consisting of 39,963,824 people shows a moderate negative correlation between the proportion of Yup'ik and percentage of population with at least 10th grade education in the United States with a correlation coefficient (R) of -0.471 and weighted average of 93.6%. Similarly, the statistical analysis conducted on geographies consisting of 55,730,379 people shows a weak positive correlation between the proportion of Bermudans and percentage of population with at least 10th grade education in the United States with a correlation coefficient (R) of 0.241 and weighted average of 93.9%, a difference of 0.38%.
10th Grade Correlation Summary
| Measurement | Yup'ik | Bermudan |
| Minimum | 80.6% | 85.4% |
| Maximum | 100.0% | 100.0% |
| Range | 19.4% | 14.6% |
| Mean | 94.0% | 95.3% |
| Median | 95.3% | 95.8% |
| Interquartile 25% (IQ1) | 90.7% | 94.0% |
| Interquartile 75% (IQ3) | 97.6% | 97.7% |
| Interquartile Range (IQR) | 6.8% | 3.6% |
| Standard Deviation (Sample) | 4.8% | 3.4% |
| Standard Deviation (Population) | 4.7% | 3.3% |
Similar Demographics by 10th Grade
Demographics Similar to Yup'ik by 10th Grade
In terms of 10th grade, the demographic groups most similar to Yup'ik are Laotian (93.6%, a difference of 0.010%), Marshallese (93.6%, a difference of 0.020%), Immigrants from Pakistan (93.6%, a difference of 0.020%), Immigrants from Malaysia (93.5%, a difference of 0.030%), and Panamanian (93.5%, a difference of 0.030%).
| Demographics | Rating | Rank | 10th Grade |
| Choctaw | 36.6 /100 | #184 | Fair 93.6% |
| Sudanese | 36.6 /100 | #185 | Fair 93.6% |
| Immigrants | Eastern Asia | 35.1 /100 | #186 | Fair 93.6% |
| Liberians | 34.7 /100 | #187 | Fair 93.6% |
| Marshallese | 33.2 /100 | #188 | Fair 93.6% |
| Immigrants | Pakistan | 32.5 /100 | #189 | Fair 93.6% |
| Laotians | 32.1 /100 | #190 | Fair 93.6% |
| Yup'ik | 31.1 /100 | #191 | Fair 93.6% |
| Immigrants | Malaysia | 28.0 /100 | #192 | Fair 93.5% |
| Panamanians | 28.0 /100 | #193 | Fair 93.5% |
| Immigrants | Morocco | 26.9 /100 | #194 | Fair 93.5% |
| Cheyenne | 26.8 /100 | #195 | Fair 93.5% |
| Moroccans | 25.3 /100 | #196 | Fair 93.5% |
| Pueblo | 23.9 /100 | #197 | Fair 93.5% |
| Immigrants | Micronesia | 23.2 /100 | #198 | Fair 93.5% |
Demographics Similar to Bermudans by 10th Grade
In terms of 10th grade, the demographic groups most similar to Bermudans are Chilean (93.9%, a difference of 0.010%), Pakistani (93.9%, a difference of 0.010%), Assyrian/Chaldean/Syriac (93.9%, a difference of 0.010%), Immigrants from Poland (93.9%, a difference of 0.020%), and Venezuelan (93.9%, a difference of 0.020%).
| Demographics | Rating | Rank | 10th Grade |
| Kenyans | 79.1 /100 | #151 | Good 94.0% |
| Immigrants | Italy | 78.0 /100 | #152 | Good 94.0% |
| Immigrants | Brazil | 75.5 /100 | #153 | Good 94.0% |
| Immigrants | Kenya | 75.3 /100 | #154 | Good 94.0% |
| Spanish | 74.9 /100 | #155 | Good 94.0% |
| Mongolians | 74.4 /100 | #156 | Good 94.0% |
| Kiowa | 73.3 /100 | #157 | Good 93.9% |
| Bermudans | 71.0 /100 | #158 | Good 93.9% |
| Chileans | 70.2 /100 | #159 | Good 93.9% |
| Pakistanis | 70.1 /100 | #160 | Good 93.9% |
| Assyrians/Chaldeans/Syriacs | 69.7 /100 | #161 | Good 93.9% |
| Immigrants | Poland | 69.6 /100 | #162 | Good 93.9% |
| Venezuelans | 69.5 /100 | #163 | Good 93.9% |
| Iraqis | 68.1 /100 | #164 | Good 93.9% |
| Brazilians | 63.6 /100 | #165 | Good 93.8% |