Immigrants from Cabo Verde vs Bermudan 10th Grade
COMPARE
Immigrants from Cabo Verde
Bermudan
10th Grade
10th Grade Comparison
Immigrants from Cabo Verde
Bermudans
89.5%
10TH GRADE
0.0/ 100
METRIC RATING
328th/ 347
METRIC RANK
93.9%
10TH GRADE
71.0/ 100
METRIC RATING
158th/ 347
METRIC RANK
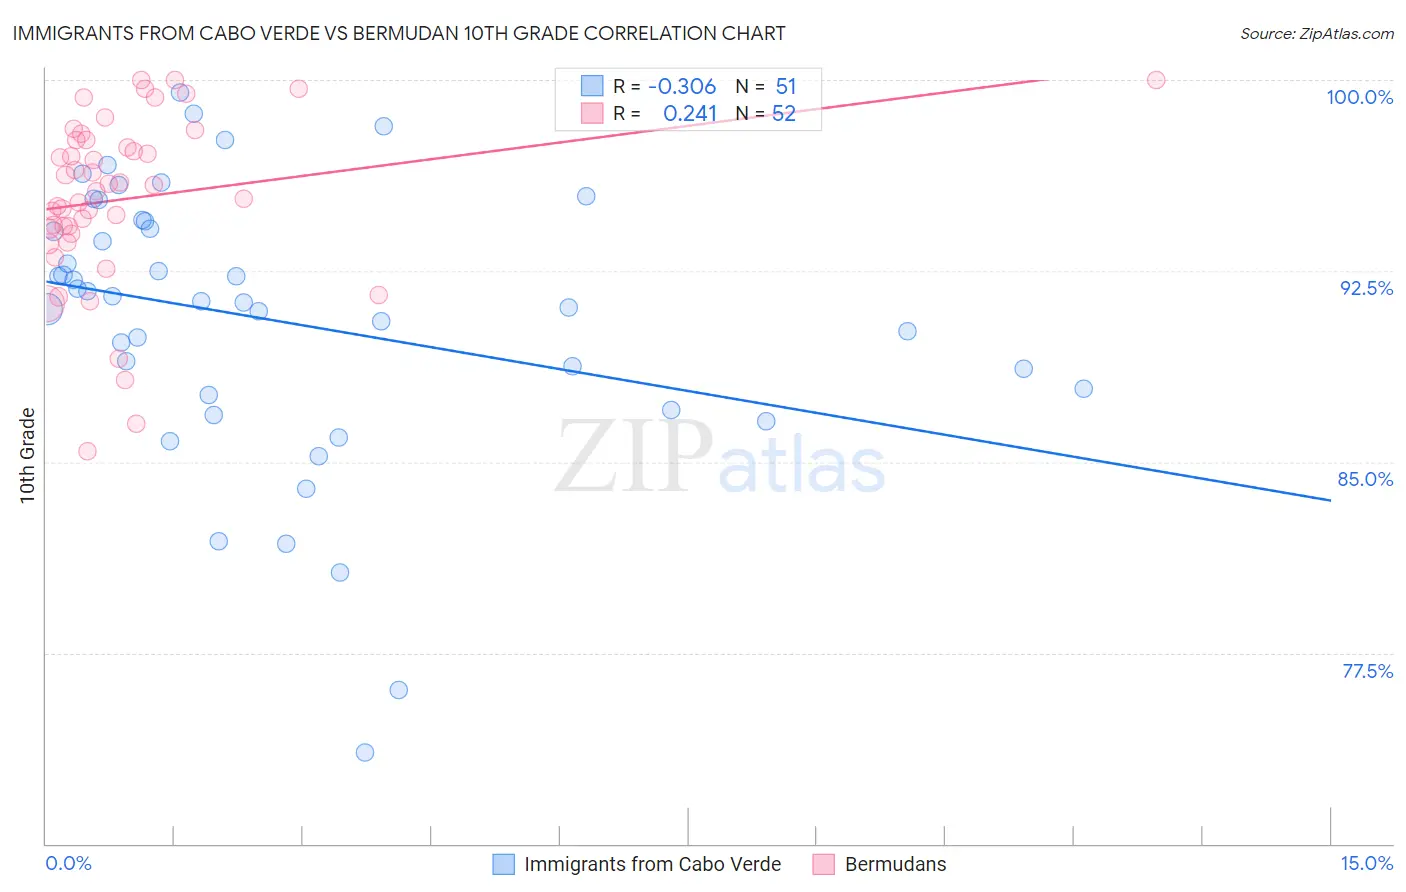
Immigrants from Cabo Verde vs Bermudan 10th Grade Correlation Chart
The statistical analysis conducted on geographies consisting of 38,158,316 people shows a mild negative correlation between the proportion of Immigrants from Cabo Verde and percentage of population with at least 10th grade education in the United States with a correlation coefficient (R) of -0.306 and weighted average of 89.5%. Similarly, the statistical analysis conducted on geographies consisting of 55,730,379 people shows a weak positive correlation between the proportion of Bermudans and percentage of population with at least 10th grade education in the United States with a correlation coefficient (R) of 0.241 and weighted average of 93.9%, a difference of 5.0%.
10th Grade Correlation Summary
| Measurement | Immigrants from Cabo Verde | Bermudan |
| Minimum | 73.6% | 85.4% |
| Maximum | 99.5% | 100.0% |
| Range | 25.9% | 14.6% |
| Mean | 90.6% | 95.3% |
| Median | 91.3% | 95.8% |
| Interquartile 25% (IQ1) | 87.6% | 94.0% |
| Interquartile 75% (IQ3) | 94.5% | 97.7% |
| Interquartile Range (IQR) | 6.8% | 3.6% |
| Standard Deviation (Sample) | 5.4% | 3.4% |
| Standard Deviation (Population) | 5.4% | 3.3% |
Similar Demographics by 10th Grade
Demographics Similar to Immigrants from Cabo Verde by 10th Grade
In terms of 10th grade, the demographic groups most similar to Immigrants from Cabo Verde are Immigrants from Nicaragua (89.5%, a difference of 0.010%), Dominican (89.4%, a difference of 0.10%), Central American Indian (89.7%, a difference of 0.27%), Puerto Rican (89.8%, a difference of 0.44%), and Immigrants from Yemen (89.1%, a difference of 0.45%).
| Demographics | Rating | Rank | 10th Grade |
| Belizeans | 0.0 /100 | #321 | Tragic 90.2% |
| Tohono O'odham | 0.0 /100 | #322 | Tragic 90.1% |
| Immigrants | Belize | 0.0 /100 | #323 | Tragic 90.1% |
| Immigrants | Armenia | 0.0 /100 | #324 | Tragic 89.9% |
| Puerto Ricans | 0.0 /100 | #325 | Tragic 89.8% |
| Central American Indians | 0.0 /100 | #326 | Tragic 89.7% |
| Immigrants | Nicaragua | 0.0 /100 | #327 | Tragic 89.5% |
| Immigrants | Cabo Verde | 0.0 /100 | #328 | Tragic 89.5% |
| Dominicans | 0.0 /100 | #329 | Tragic 89.4% |
| Immigrants | Yemen | 0.0 /100 | #330 | Tragic 89.1% |
| Mexican American Indians | 0.0 /100 | #331 | Tragic 89.0% |
| Immigrants | Azores | 0.0 /100 | #332 | Tragic 89.0% |
| Hondurans | 0.0 /100 | #333 | Tragic 89.0% |
| Hispanics or Latinos | 0.0 /100 | #334 | Tragic 88.9% |
| Immigrants | Dominican Republic | 0.0 /100 | #335 | Tragic 88.7% |
Demographics Similar to Bermudans by 10th Grade
In terms of 10th grade, the demographic groups most similar to Bermudans are Chilean (93.9%, a difference of 0.010%), Pakistani (93.9%, a difference of 0.010%), Assyrian/Chaldean/Syriac (93.9%, a difference of 0.010%), Immigrants from Poland (93.9%, a difference of 0.020%), and Venezuelan (93.9%, a difference of 0.020%).
| Demographics | Rating | Rank | 10th Grade |
| Kenyans | 79.1 /100 | #151 | Good 94.0% |
| Immigrants | Italy | 78.0 /100 | #152 | Good 94.0% |
| Immigrants | Brazil | 75.5 /100 | #153 | Good 94.0% |
| Immigrants | Kenya | 75.3 /100 | #154 | Good 94.0% |
| Spanish | 74.9 /100 | #155 | Good 94.0% |
| Mongolians | 74.4 /100 | #156 | Good 94.0% |
| Kiowa | 73.3 /100 | #157 | Good 93.9% |
| Bermudans | 71.0 /100 | #158 | Good 93.9% |
| Chileans | 70.2 /100 | #159 | Good 93.9% |
| Pakistanis | 70.1 /100 | #160 | Good 93.9% |
| Assyrians/Chaldeans/Syriacs | 69.7 /100 | #161 | Good 93.9% |
| Immigrants | Poland | 69.6 /100 | #162 | Good 93.9% |
| Venezuelans | 69.5 /100 | #163 | Good 93.9% |
| Iraqis | 68.1 /100 | #164 | Good 93.9% |
| Brazilians | 63.6 /100 | #165 | Good 93.8% |