Peruvian vs Puget Sound Salish Professional Degree
COMPARE
Peruvian
Puget Sound Salish
Professional Degree
Professional Degree Comparison
Peruvians
Puget Sound Salish
4.5%
PROFESSIONAL DEGREE
65.2/ 100
METRIC RATING
162nd/ 347
METRIC RANK
3.1%
PROFESSIONAL DEGREE
0.0/ 100
METRIC RATING
333rd/ 347
METRIC RANK
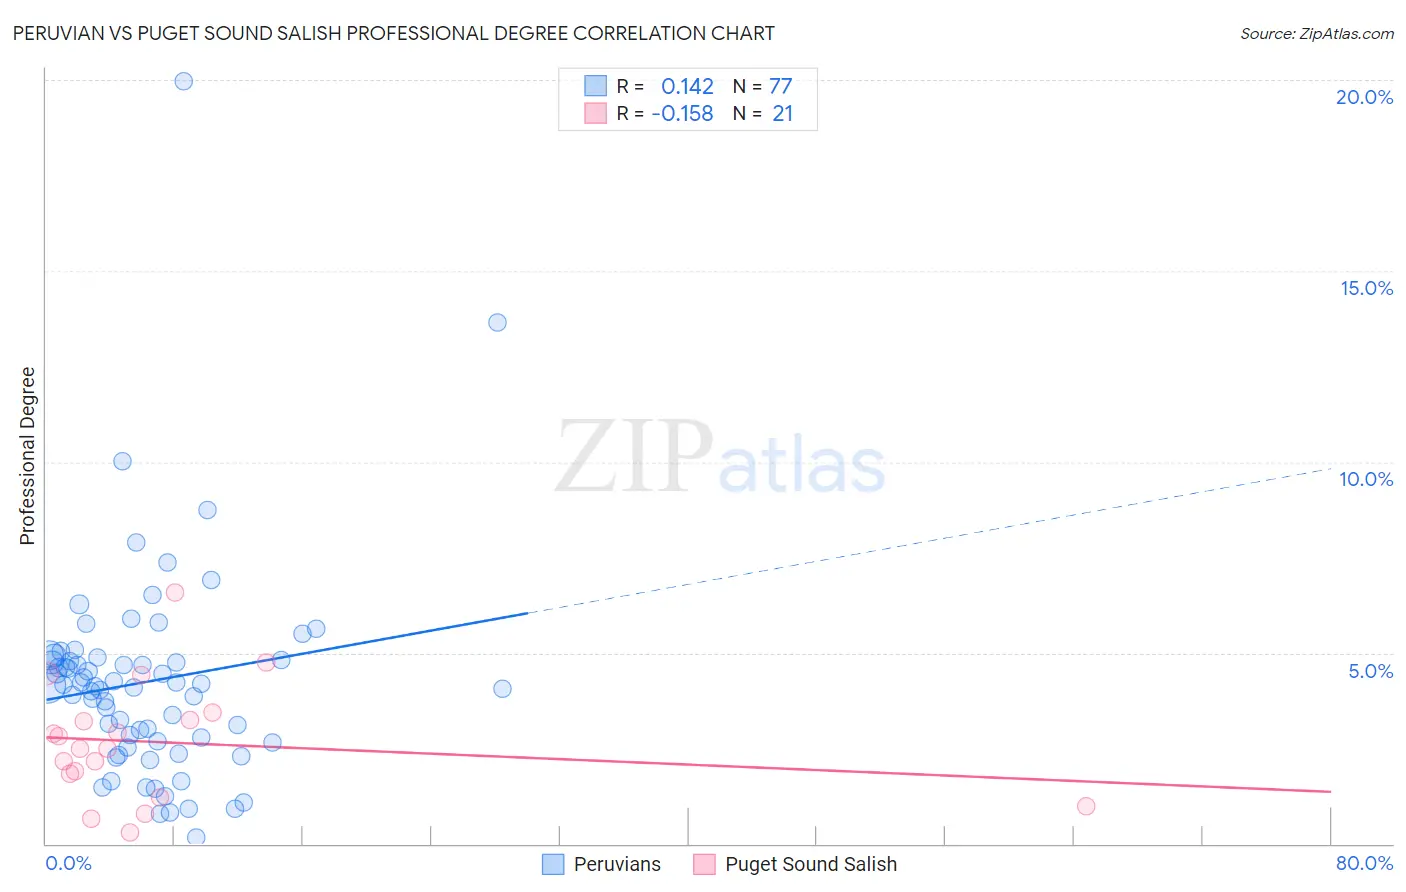
Peruvian vs Puget Sound Salish Professional Degree Correlation Chart
The statistical analysis conducted on geographies consisting of 362,706,840 people shows a poor positive correlation between the proportion of Peruvians and percentage of population with at least professional degree education in the United States with a correlation coefficient (R) of 0.142 and weighted average of 4.5%. Similarly, the statistical analysis conducted on geographies consisting of 46,093,850 people shows a poor negative correlation between the proportion of Puget Sound Salish and percentage of population with at least professional degree education in the United States with a correlation coefficient (R) of -0.158 and weighted average of 3.1%, a difference of 46.4%.
Professional Degree Correlation Summary
| Measurement | Peruvian | Puget Sound Salish |
| Minimum | 0.17% | 0.31% |
| Maximum | 20.0% | 6.6% |
| Range | 19.8% | 6.3% |
| Mean | 4.2% | 2.7% |
| Median | 4.1% | 2.5% |
| Interquartile 25% (IQ1) | 2.7% | 1.5% |
| Interquartile 75% (IQ3) | 4.8% | 3.3% |
| Interquartile Range (IQR) | 2.2% | 1.8% |
| Standard Deviation (Sample) | 2.8% | 1.5% |
| Standard Deviation (Population) | 2.8% | 1.5% |
Similar Demographics by Professional Degree
Demographics Similar to Peruvians by Professional Degree
In terms of professional degree, the demographic groups most similar to Peruvians are Sierra Leonean (4.5%, a difference of 0.14%), Assyrian/Chaldean/Syriac (4.5%, a difference of 0.34%), Immigrants from Senegal (4.5%, a difference of 0.44%), Vietnamese (4.5%, a difference of 0.50%), and Immigrants from Armenia (4.5%, a difference of 0.58%).
| Demographics | Rating | Rank | Professional Degree |
| Slavs | 70.8 /100 | #155 | Good 4.5% |
| Swedes | 69.9 /100 | #156 | Good 4.5% |
| Iraqis | 69.8 /100 | #157 | Good 4.5% |
| Immigrants | Armenia | 68.8 /100 | #158 | Good 4.5% |
| Vietnamese | 68.4 /100 | #159 | Good 4.5% |
| Immigrants | Senegal | 68.0 /100 | #160 | Good 4.5% |
| Assyrians/Chaldeans/Syriacs | 67.4 /100 | #161 | Good 4.5% |
| Peruvians | 65.2 /100 | #162 | Good 4.5% |
| Sierra Leoneans | 64.3 /100 | #163 | Good 4.5% |
| Swiss | 61.0 /100 | #164 | Good 4.5% |
| Costa Ricans | 59.9 /100 | #165 | Average 4.5% |
| Immigrants | Colombia | 59.4 /100 | #166 | Average 4.5% |
| Immigrants | Afghanistan | 59.2 /100 | #167 | Average 4.5% |
| Immigrants | Sierra Leone | 58.7 /100 | #168 | Average 4.5% |
| Chinese | 58.6 /100 | #169 | Average 4.5% |
Demographics Similar to Puget Sound Salish by Professional Degree
In terms of professional degree, the demographic groups most similar to Puget Sound Salish are Yakama (3.1%, a difference of 0.030%), Kiowa (3.1%, a difference of 0.14%), Immigrants from Cabo Verde (3.1%, a difference of 0.26%), Bangladeshi (3.1%, a difference of 0.34%), and Creek (3.1%, a difference of 0.55%).
| Demographics | Rating | Rank | Professional Degree |
| Menominee | 0.0 /100 | #326 | Tragic 3.1% |
| Dutch West Indians | 0.0 /100 | #327 | Tragic 3.1% |
| Creek | 0.0 /100 | #328 | Tragic 3.1% |
| Bangladeshis | 0.0 /100 | #329 | Tragic 3.1% |
| Immigrants | Cabo Verde | 0.0 /100 | #330 | Tragic 3.1% |
| Kiowa | 0.0 /100 | #331 | Tragic 3.1% |
| Yakama | 0.0 /100 | #332 | Tragic 3.1% |
| Puget Sound Salish | 0.0 /100 | #333 | Tragic 3.1% |
| Pennsylvania Germans | 0.0 /100 | #334 | Tragic 3.0% |
| Natives/Alaskans | 0.0 /100 | #335 | Tragic 3.0% |
| Fijians | 0.0 /100 | #336 | Tragic 2.9% |
| Arapaho | 0.0 /100 | #337 | Tragic 2.9% |
| Navajo | 0.0 /100 | #338 | Tragic 2.9% |
| Immigrants | Central America | 0.0 /100 | #339 | Tragic 2.9% |
| Yup'ik | 0.0 /100 | #340 | Tragic 2.9% |