Peruvian vs Immigrants from Costa Rica Professional Degree
COMPARE
Peruvian
Immigrants from Costa Rica
Professional Degree
Professional Degree Comparison
Peruvians
Immigrants from Costa Rica
4.5%
PROFESSIONAL DEGREE
65.2/ 100
METRIC RATING
162nd/ 347
METRIC RANK
4.4%
PROFESSIONAL DEGREE
46.7/ 100
METRIC RATING
178th/ 347
METRIC RANK
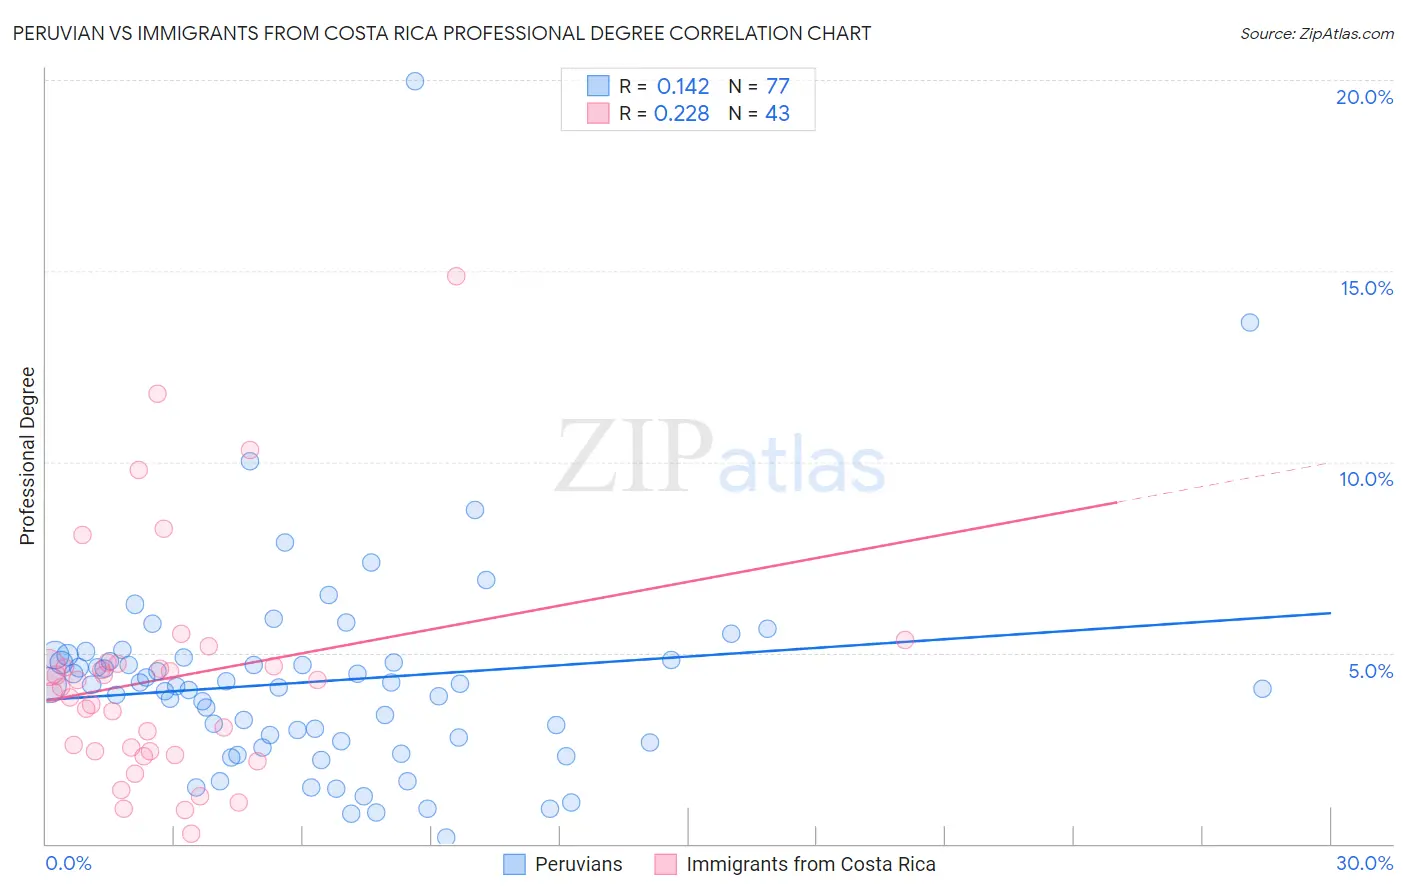
Peruvian vs Immigrants from Costa Rica Professional Degree Correlation Chart
The statistical analysis conducted on geographies consisting of 362,706,840 people shows a poor positive correlation between the proportion of Peruvians and percentage of population with at least professional degree education in the United States with a correlation coefficient (R) of 0.142 and weighted average of 4.5%. Similarly, the statistical analysis conducted on geographies consisting of 204,151,669 people shows a weak positive correlation between the proportion of Immigrants from Costa Rica and percentage of population with at least professional degree education in the United States with a correlation coefficient (R) of 0.228 and weighted average of 4.4%, a difference of 2.8%.
Professional Degree Correlation Summary
| Measurement | Peruvian | Immigrants from Costa Rica |
| Minimum | 0.17% | 0.26% |
| Maximum | 20.0% | 14.9% |
| Range | 19.8% | 14.6% |
| Mean | 4.2% | 4.3% |
| Median | 4.1% | 4.1% |
| Interquartile 25% (IQ1) | 2.7% | 2.4% |
| Interquartile 75% (IQ3) | 4.8% | 4.7% |
| Interquartile Range (IQR) | 2.2% | 2.3% |
| Standard Deviation (Sample) | 2.8% | 3.0% |
| Standard Deviation (Population) | 2.8% | 2.9% |
Demographics Similar to Peruvians and Immigrants from Costa Rica by Professional Degree
In terms of professional degree, the demographic groups most similar to Peruvians are Sierra Leonean (4.5%, a difference of 0.14%), Assyrian/Chaldean/Syriac (4.5%, a difference of 0.34%), Immigrants from Senegal (4.5%, a difference of 0.44%), Swiss (4.5%, a difference of 0.65%), and Costa Rican (4.5%, a difference of 0.81%). Similarly, the demographic groups most similar to Immigrants from Costa Rica are Immigrants from Kenya (4.4%, a difference of 0.11%), Celtic (4.4%, a difference of 0.13%), Czech (4.4%, a difference of 0.26%), Immigrants from Peru (4.4%, a difference of 0.39%), and Irish (4.4%, a difference of 0.48%).
| Demographics | Rating | Rank | Professional Degree |
| Immigrants | Senegal | 68.0 /100 | #160 | Good 4.5% |
| Assyrians/Chaldeans/Syriacs | 67.4 /100 | #161 | Good 4.5% |
| Peruvians | 65.2 /100 | #162 | Good 4.5% |
| Sierra Leoneans | 64.3 /100 | #163 | Good 4.5% |
| Swiss | 61.0 /100 | #164 | Good 4.5% |
| Costa Ricans | 59.9 /100 | #165 | Average 4.5% |
| Immigrants | Colombia | 59.4 /100 | #166 | Average 4.5% |
| Immigrants | Afghanistan | 59.2 /100 | #167 | Average 4.5% |
| Immigrants | Sierra Leone | 58.7 /100 | #168 | Average 4.5% |
| Chinese | 58.6 /100 | #169 | Average 4.5% |
| Immigrants | Zaire | 57.4 /100 | #170 | Average 4.5% |
| Immigrants | Bangladesh | 56.0 /100 | #171 | Average 4.4% |
| Spaniards | 52.0 /100 | #172 | Average 4.4% |
| English | 50.1 /100 | #173 | Average 4.4% |
| Kenyans | 50.0 /100 | #174 | Average 4.4% |
| Irish | 50.0 /100 | #175 | Average 4.4% |
| Immigrants | Peru | 49.3 /100 | #176 | Average 4.4% |
| Celtics | 47.6 /100 | #177 | Average 4.4% |
| Immigrants | Costa Rica | 46.7 /100 | #178 | Average 4.4% |
| Immigrants | Kenya | 45.9 /100 | #179 | Average 4.4% |
| Czechs | 44.9 /100 | #180 | Average 4.4% |