Portuguese vs Puget Sound Salish Professional Degree
COMPARE
Portuguese
Puget Sound Salish
Professional Degree
Professional Degree Comparison
Portuguese
Puget Sound Salish
4.1%
PROFESSIONAL DEGREE
10.5/ 100
METRIC RATING
215th/ 347
METRIC RANK
3.1%
PROFESSIONAL DEGREE
0.0/ 100
METRIC RATING
333rd/ 347
METRIC RANK
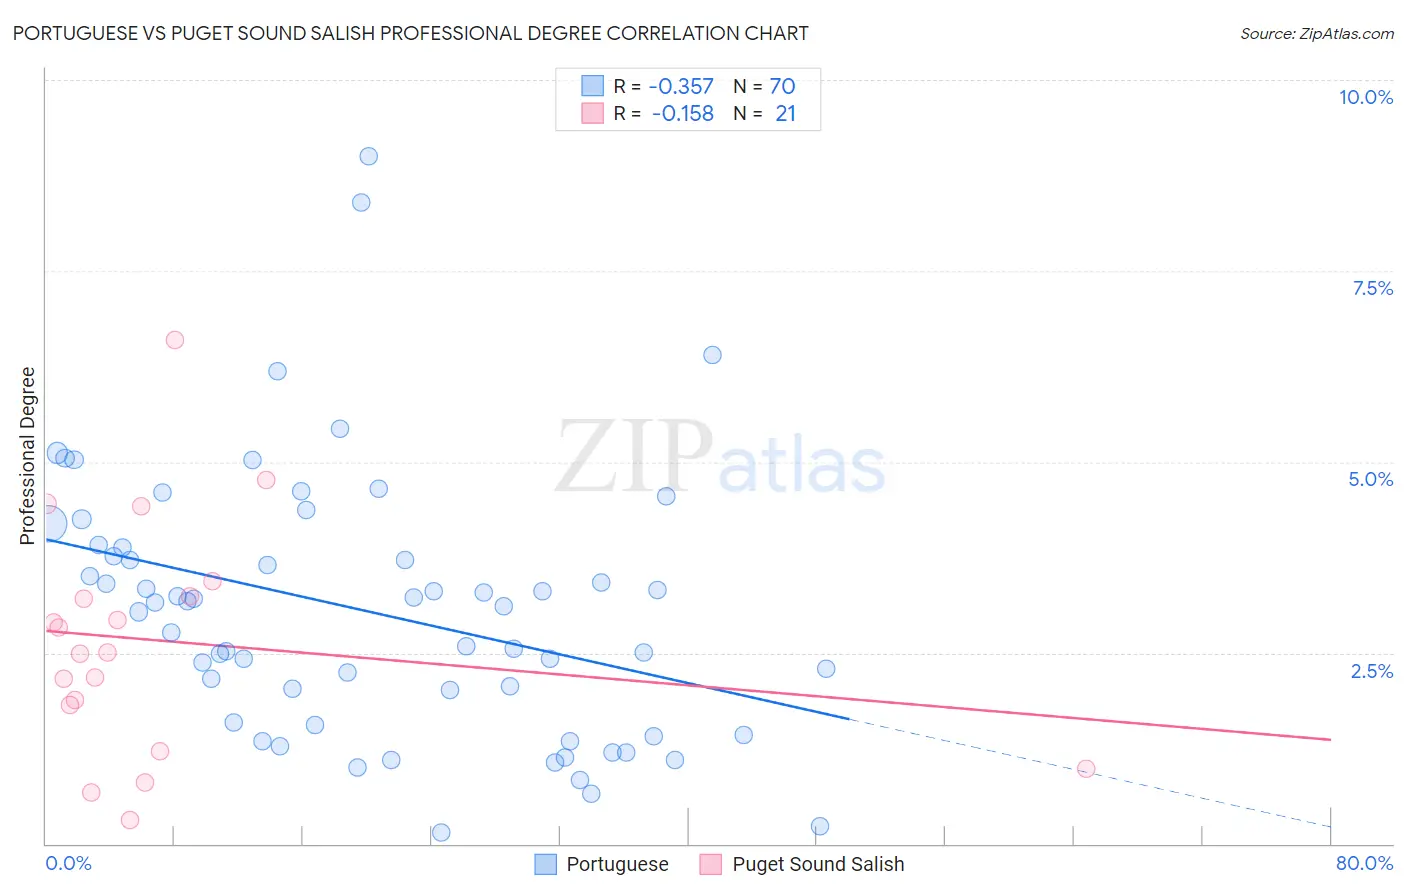
Portuguese vs Puget Sound Salish Professional Degree Correlation Chart
The statistical analysis conducted on geographies consisting of 448,577,739 people shows a mild negative correlation between the proportion of Portuguese and percentage of population with at least professional degree education in the United States with a correlation coefficient (R) of -0.357 and weighted average of 4.1%. Similarly, the statistical analysis conducted on geographies consisting of 46,093,850 people shows a poor negative correlation between the proportion of Puget Sound Salish and percentage of population with at least professional degree education in the United States with a correlation coefficient (R) of -0.158 and weighted average of 3.1%, a difference of 32.0%.
Professional Degree Correlation Summary
| Measurement | Portuguese | Puget Sound Salish |
| Minimum | 0.14% | 0.31% |
| Maximum | 9.0% | 6.6% |
| Range | 8.9% | 6.3% |
| Mean | 3.1% | 2.7% |
| Median | 3.1% | 2.5% |
| Interquartile 25% (IQ1) | 1.6% | 1.5% |
| Interquartile 75% (IQ3) | 3.9% | 3.3% |
| Interquartile Range (IQR) | 2.3% | 1.8% |
| Standard Deviation (Sample) | 1.7% | 1.5% |
| Standard Deviation (Population) | 1.7% | 1.5% |
Similar Demographics by Professional Degree
Demographics Similar to Portuguese by Professional Degree
In terms of professional degree, the demographic groups most similar to Portuguese are Immigrants from Ghana (4.1%, a difference of 0.050%), Korean (4.1%, a difference of 0.10%), White/Caucasian (4.1%, a difference of 0.28%), West Indian (4.1%, a difference of 0.31%), and German (4.1%, a difference of 0.46%).
| Demographics | Rating | Rank | Professional Degree |
| Immigrants | Somalia | 12.5 /100 | #208 | Poor 4.1% |
| Immigrants | Panama | 12.3 /100 | #209 | Poor 4.1% |
| Immigrants | Nigeria | 11.7 /100 | #210 | Poor 4.1% |
| Germans | 11.6 /100 | #211 | Poor 4.1% |
| Whites/Caucasians | 11.2 /100 | #212 | Poor 4.1% |
| Koreans | 10.7 /100 | #213 | Poor 4.1% |
| Immigrants | Ghana | 10.6 /100 | #214 | Poor 4.1% |
| Portuguese | 10.5 /100 | #215 | Poor 4.1% |
| West Indians | 9.8 /100 | #216 | Tragic 4.1% |
| Immigrants | Vietnam | 9.4 /100 | #217 | Tragic 4.0% |
| Dutch | 9.0 /100 | #218 | Tragic 4.0% |
| Immigrants | South Eastern Asia | 8.9 /100 | #219 | Tragic 4.0% |
| Ute | 8.2 /100 | #220 | Tragic 4.0% |
| French Canadians | 8.0 /100 | #221 | Tragic 4.0% |
| Immigrants | Western Africa | 7.5 /100 | #222 | Tragic 4.0% |
Demographics Similar to Puget Sound Salish by Professional Degree
In terms of professional degree, the demographic groups most similar to Puget Sound Salish are Yakama (3.1%, a difference of 0.030%), Kiowa (3.1%, a difference of 0.14%), Immigrants from Cabo Verde (3.1%, a difference of 0.26%), Bangladeshi (3.1%, a difference of 0.34%), and Creek (3.1%, a difference of 0.55%).
| Demographics | Rating | Rank | Professional Degree |
| Menominee | 0.0 /100 | #326 | Tragic 3.1% |
| Dutch West Indians | 0.0 /100 | #327 | Tragic 3.1% |
| Creek | 0.0 /100 | #328 | Tragic 3.1% |
| Bangladeshis | 0.0 /100 | #329 | Tragic 3.1% |
| Immigrants | Cabo Verde | 0.0 /100 | #330 | Tragic 3.1% |
| Kiowa | 0.0 /100 | #331 | Tragic 3.1% |
| Yakama | 0.0 /100 | #332 | Tragic 3.1% |
| Puget Sound Salish | 0.0 /100 | #333 | Tragic 3.1% |
| Pennsylvania Germans | 0.0 /100 | #334 | Tragic 3.0% |
| Natives/Alaskans | 0.0 /100 | #335 | Tragic 3.0% |
| Fijians | 0.0 /100 | #336 | Tragic 2.9% |
| Arapaho | 0.0 /100 | #337 | Tragic 2.9% |
| Navajo | 0.0 /100 | #338 | Tragic 2.9% |
| Immigrants | Central America | 0.0 /100 | #339 | Tragic 2.9% |
| Yup'ik | 0.0 /100 | #340 | Tragic 2.9% |