Peruvian vs Puget Sound Salish Unemployment Among Seniors over 75 years
COMPARE
Peruvian
Puget Sound Salish
Unemployment Among Seniors over 75 years
Unemployment Among Seniors over 75 years Comparison
Peruvians
Puget Sound Salish
9.0%
UNEMPLOYMENT AMONG SENIORS OVER 75 YEARS
7.3/ 100
METRIC RATING
222nd/ 347
METRIC RANK
10.0%
UNEMPLOYMENT AMONG SENIORS OVER 75 YEARS
0.0/ 100
METRIC RATING
303rd/ 347
METRIC RANK
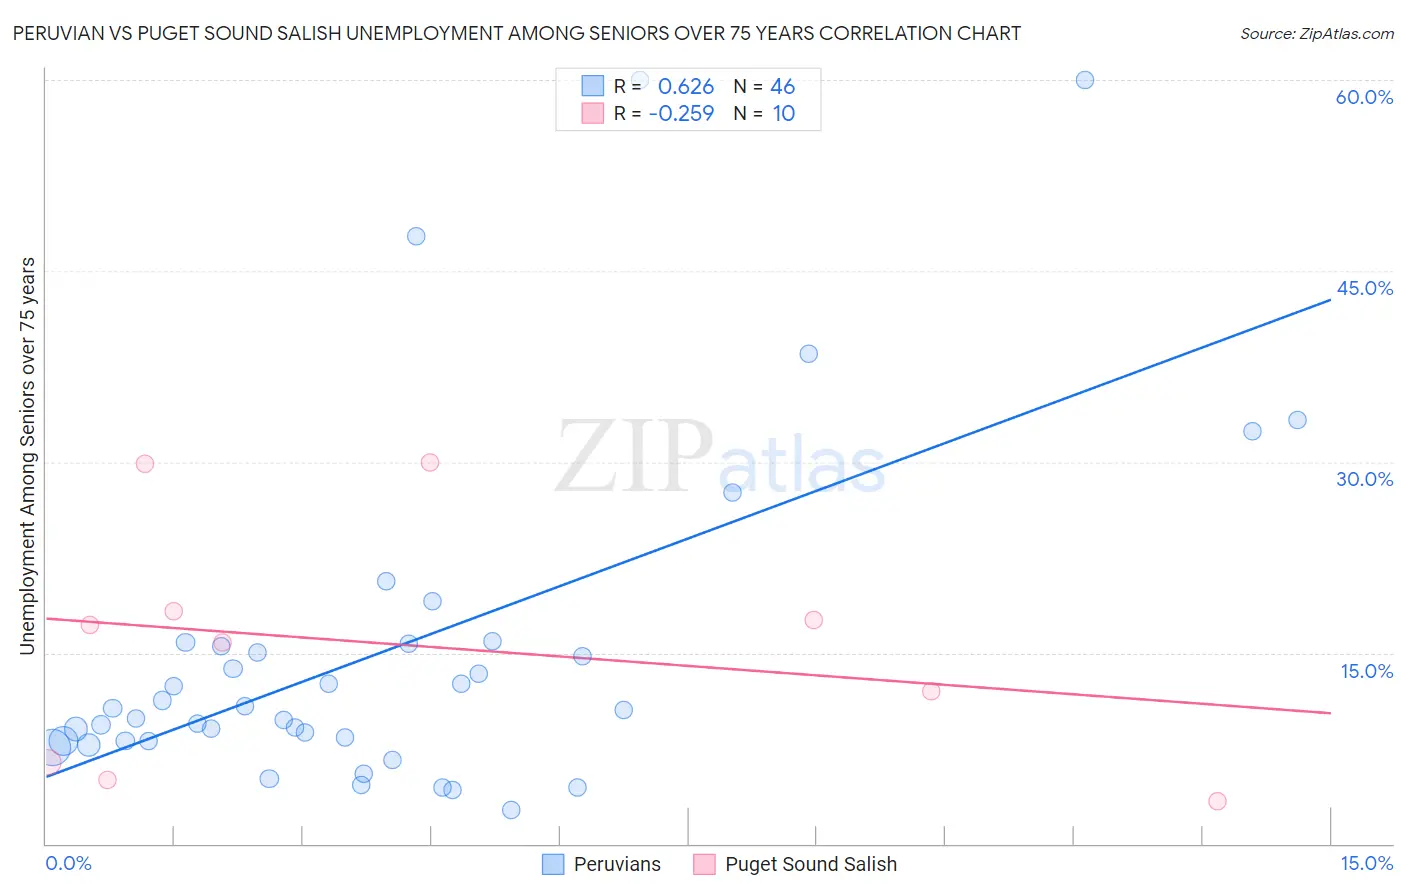
Peruvian vs Puget Sound Salish Unemployment Among Seniors over 75 years Correlation Chart
The statistical analysis conducted on geographies consisting of 193,571,064 people shows a significant positive correlation between the proportion of Peruvians and unemployment rate among seniors over the age of 75 in the United States with a correlation coefficient (R) of 0.626 and weighted average of 9.0%. Similarly, the statistical analysis conducted on geographies consisting of 33,735,975 people shows a weak negative correlation between the proportion of Puget Sound Salish and unemployment rate among seniors over the age of 75 in the United States with a correlation coefficient (R) of -0.259 and weighted average of 10.0%, a difference of 10.3%.
Unemployment Among Seniors over 75 years Correlation Summary
| Measurement | Peruvian | Puget Sound Salish |
| Minimum | 2.7% | 3.3% |
| Maximum | 60.0% | 30.0% |
| Range | 57.3% | 26.7% |
| Mean | 15.2% | 15.5% |
| Median | 10.6% | 16.5% |
| Interquartile 25% (IQ1) | 8.1% | 6.4% |
| Interquartile 75% (IQ3) | 15.7% | 18.3% |
| Interquartile Range (IQR) | 7.6% | 11.9% |
| Standard Deviation (Sample) | 13.4% | 9.3% |
| Standard Deviation (Population) | 13.2% | 8.9% |
Similar Demographics by Unemployment Among Seniors over 75 years
Demographics Similar to Peruvians by Unemployment Among Seniors over 75 years
In terms of unemployment among seniors over 75 years, the demographic groups most similar to Peruvians are Guamanian/Chamorro (9.0%, a difference of 0.070%), Immigrants from Jordan (9.0%, a difference of 0.070%), Immigrants from Zimbabwe (9.0%, a difference of 0.10%), Afghan (9.0%, a difference of 0.18%), and Costa Rican (9.1%, a difference of 0.20%).
| Demographics | Rating | Rank | Unemployment Among Seniors over 75 years |
| Immigrants | Western Asia | 12.5 /100 | #215 | Poor 9.0% |
| Immigrants | Oceania | 11.8 /100 | #216 | Poor 9.0% |
| Lebanese | 11.1 /100 | #217 | Poor 9.0% |
| Immigrants | Africa | 9.7 /100 | #218 | Tragic 9.0% |
| Afghans | 8.3 /100 | #219 | Tragic 9.0% |
| Immigrants | Zimbabwe | 7.8 /100 | #220 | Tragic 9.0% |
| Guamanians/Chamorros | 7.7 /100 | #221 | Tragic 9.0% |
| Peruvians | 7.3 /100 | #222 | Tragic 9.0% |
| Immigrants | Jordan | 6.9 /100 | #223 | Tragic 9.0% |
| Costa Ricans | 6.3 /100 | #224 | Tragic 9.1% |
| Navajo | 6.1 /100 | #225 | Tragic 9.1% |
| Immigrants | Bangladesh | 5.9 /100 | #226 | Tragic 9.1% |
| Samoans | 5.7 /100 | #227 | Tragic 9.1% |
| Kenyans | 5.4 /100 | #228 | Tragic 9.1% |
| Hispanics or Latinos | 5.0 /100 | #229 | Tragic 9.1% |
Demographics Similar to Puget Sound Salish by Unemployment Among Seniors over 75 years
In terms of unemployment among seniors over 75 years, the demographic groups most similar to Puget Sound Salish are Scotch-Irish (10.0%, a difference of 0.010%), Finnish (10.0%, a difference of 0.070%), Welsh (10.0%, a difference of 0.18%), Swedish (10.0%, a difference of 0.20%), and Italian (10.0%, a difference of 0.35%).
| Demographics | Rating | Rank | Unemployment Among Seniors over 75 years |
| Immigrants | St. Vincent and the Grenadines | 0.0 /100 | #296 | Tragic 9.8% |
| Cherokee | 0.0 /100 | #297 | Tragic 9.8% |
| Lithuanians | 0.0 /100 | #298 | Tragic 9.9% |
| Belgians | 0.0 /100 | #299 | Tragic 9.9% |
| Iraqis | 0.0 /100 | #300 | Tragic 9.9% |
| Welsh | 0.0 /100 | #301 | Tragic 10.0% |
| Finns | 0.0 /100 | #302 | Tragic 10.0% |
| Puget Sound Salish | 0.0 /100 | #303 | Tragic 10.0% |
| Scotch-Irish | 0.0 /100 | #304 | Tragic 10.0% |
| Swedes | 0.0 /100 | #305 | Tragic 10.0% |
| Italians | 0.0 /100 | #306 | Tragic 10.0% |
| Immigrants | Fiji | 0.0 /100 | #307 | Tragic 10.0% |
| Whites/Caucasians | 0.0 /100 | #308 | Tragic 10.1% |
| English | 0.0 /100 | #309 | Tragic 10.1% |
| Hungarians | 0.0 /100 | #310 | Tragic 10.1% |