Peruvian vs Salvadoran Professional Degree
COMPARE
Peruvian
Salvadoran
Professional Degree
Professional Degree Comparison
Peruvians
Salvadorans
4.5%
PROFESSIONAL DEGREE
65.2/ 100
METRIC RATING
162nd/ 347
METRIC RANK
3.5%
PROFESSIONAL DEGREE
0.4/ 100
METRIC RATING
284th/ 347
METRIC RANK
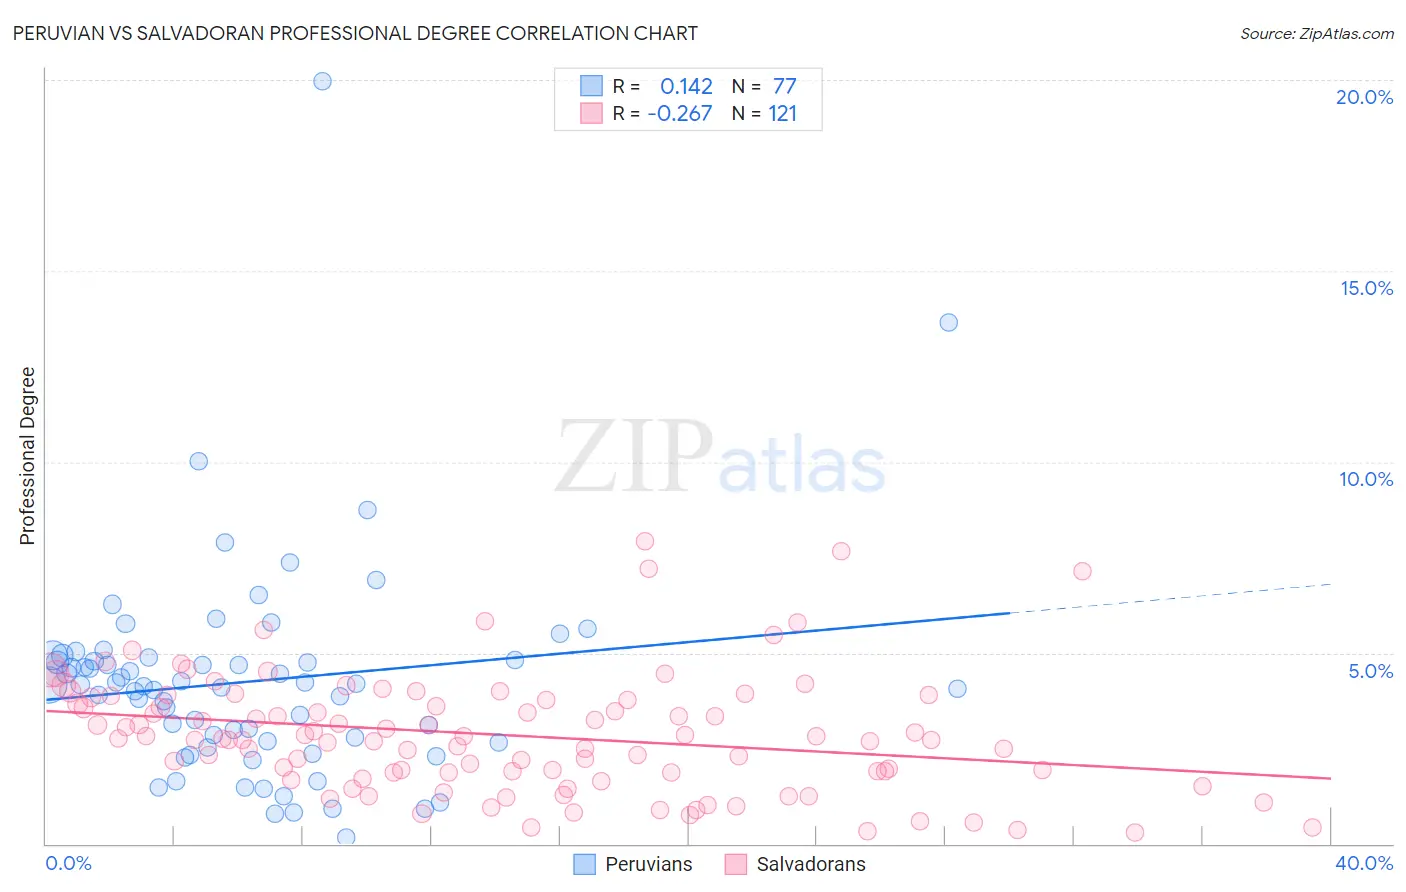
Peruvian vs Salvadoran Professional Degree Correlation Chart
The statistical analysis conducted on geographies consisting of 362,706,840 people shows a poor positive correlation between the proportion of Peruvians and percentage of population with at least professional degree education in the United States with a correlation coefficient (R) of 0.142 and weighted average of 4.5%. Similarly, the statistical analysis conducted on geographies consisting of 397,494,497 people shows a weak negative correlation between the proportion of Salvadorans and percentage of population with at least professional degree education in the United States with a correlation coefficient (R) of -0.267 and weighted average of 3.5%, a difference of 27.7%.
Professional Degree Correlation Summary
| Measurement | Peruvian | Salvadoran |
| Minimum | 0.17% | 0.29% |
| Maximum | 20.0% | 7.9% |
| Range | 19.8% | 7.6% |
| Mean | 4.2% | 2.8% |
| Median | 4.1% | 2.8% |
| Interquartile 25% (IQ1) | 2.7% | 1.9% |
| Interquartile 75% (IQ3) | 4.8% | 3.8% |
| Interquartile Range (IQR) | 2.2% | 1.9% |
| Standard Deviation (Sample) | 2.8% | 1.5% |
| Standard Deviation (Population) | 2.8% | 1.5% |
Similar Demographics by Professional Degree
Demographics Similar to Peruvians by Professional Degree
In terms of professional degree, the demographic groups most similar to Peruvians are Sierra Leonean (4.5%, a difference of 0.14%), Assyrian/Chaldean/Syriac (4.5%, a difference of 0.34%), Immigrants from Senegal (4.5%, a difference of 0.44%), Vietnamese (4.5%, a difference of 0.50%), and Immigrants from Armenia (4.5%, a difference of 0.58%).
| Demographics | Rating | Rank | Professional Degree |
| Slavs | 70.8 /100 | #155 | Good 4.5% |
| Swedes | 69.9 /100 | #156 | Good 4.5% |
| Iraqis | 69.8 /100 | #157 | Good 4.5% |
| Immigrants | Armenia | 68.8 /100 | #158 | Good 4.5% |
| Vietnamese | 68.4 /100 | #159 | Good 4.5% |
| Immigrants | Senegal | 68.0 /100 | #160 | Good 4.5% |
| Assyrians/Chaldeans/Syriacs | 67.4 /100 | #161 | Good 4.5% |
| Peruvians | 65.2 /100 | #162 | Good 4.5% |
| Sierra Leoneans | 64.3 /100 | #163 | Good 4.5% |
| Swiss | 61.0 /100 | #164 | Good 4.5% |
| Costa Ricans | 59.9 /100 | #165 | Average 4.5% |
| Immigrants | Colombia | 59.4 /100 | #166 | Average 4.5% |
| Immigrants | Afghanistan | 59.2 /100 | #167 | Average 4.5% |
| Immigrants | Sierra Leone | 58.7 /100 | #168 | Average 4.5% |
| Chinese | 58.6 /100 | #169 | Average 4.5% |
Demographics Similar to Salvadorans by Professional Degree
In terms of professional degree, the demographic groups most similar to Salvadorans are Comanche (3.5%, a difference of 0.10%), Immigrants from Caribbean (3.5%, a difference of 0.40%), Apache (3.5%, a difference of 0.42%), Dominican (3.5%, a difference of 0.45%), and Immigrants from Portugal (3.5%, a difference of 0.48%).
| Demographics | Rating | Rank | Professional Degree |
| Cheyenne | 0.5 /100 | #277 | Tragic 3.6% |
| Japanese | 0.5 /100 | #278 | Tragic 3.5% |
| Immigrants | Portugal | 0.5 /100 | #279 | Tragic 3.5% |
| Dominicans | 0.5 /100 | #280 | Tragic 3.5% |
| Apache | 0.5 /100 | #281 | Tragic 3.5% |
| Immigrants | Caribbean | 0.5 /100 | #282 | Tragic 3.5% |
| Comanche | 0.4 /100 | #283 | Tragic 3.5% |
| Salvadorans | 0.4 /100 | #284 | Tragic 3.5% |
| Hondurans | 0.3 /100 | #285 | Tragic 3.5% |
| Haitians | 0.3 /100 | #286 | Tragic 3.5% |
| Immigrants | El Salvador | 0.3 /100 | #287 | Tragic 3.5% |
| Blackfeet | 0.3 /100 | #288 | Tragic 3.5% |
| Guatemalans | 0.3 /100 | #289 | Tragic 3.5% |
| Chippewa | 0.3 /100 | #290 | Tragic 3.5% |
| Alaska Natives | 0.3 /100 | #291 | Tragic 3.5% |