Peruvian vs Immigrants from Nicaragua 7th Grade
COMPARE
Peruvian
Immigrants from Nicaragua
7th Grade
7th Grade Comparison
Peruvians
Immigrants from Nicaragua
95.1%
7TH GRADE
0.2/ 100
METRIC RATING
272nd/ 347
METRIC RANK
93.0%
7TH GRADE
0.0/ 100
METRIC RATING
328th/ 347
METRIC RANK
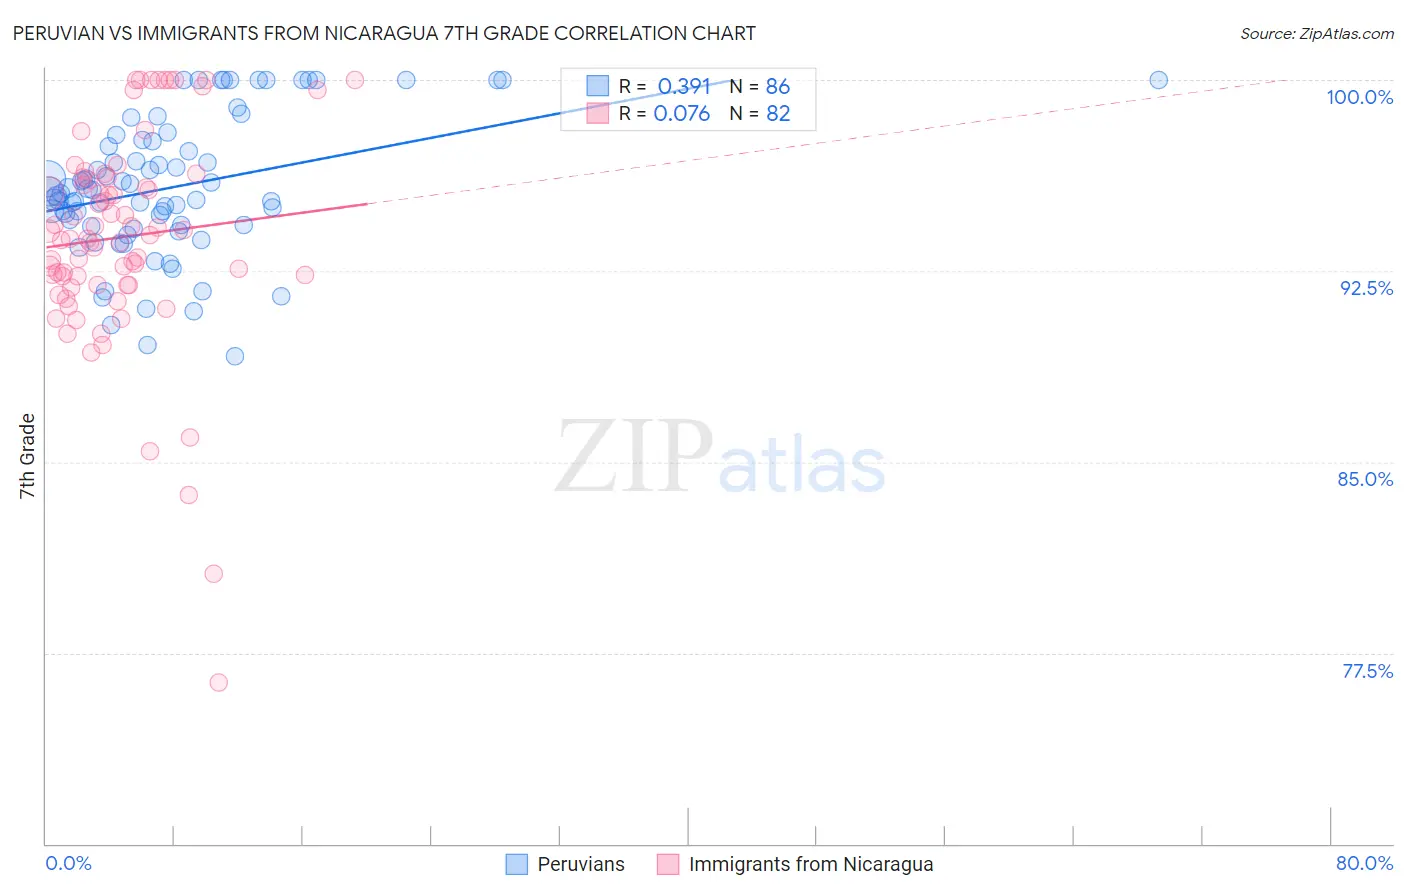
Peruvian vs Immigrants from Nicaragua 7th Grade Correlation Chart
The statistical analysis conducted on geographies consisting of 363,068,462 people shows a mild positive correlation between the proportion of Peruvians and percentage of population with at least 7th grade education in the United States with a correlation coefficient (R) of 0.391 and weighted average of 95.1%. Similarly, the statistical analysis conducted on geographies consisting of 236,340,506 people shows a slight positive correlation between the proportion of Immigrants from Nicaragua and percentage of population with at least 7th grade education in the United States with a correlation coefficient (R) of 0.076 and weighted average of 93.0%, a difference of 2.3%.
7th Grade Correlation Summary
| Measurement | Peruvian | Immigrants from Nicaragua |
| Minimum | 89.1% | 76.3% |
| Maximum | 100.0% | 100.0% |
| Range | 10.9% | 23.7% |
| Mean | 95.8% | 93.8% |
| Median | 95.6% | 93.8% |
| Interquartile 25% (IQ1) | 94.3% | 92.0% |
| Interquartile 75% (IQ3) | 97.6% | 96.2% |
| Interquartile Range (IQR) | 3.3% | 4.2% |
| Standard Deviation (Sample) | 2.7% | 4.2% |
| Standard Deviation (Population) | 2.7% | 4.2% |
Similar Demographics by 7th Grade
Demographics Similar to Peruvians by 7th Grade
In terms of 7th grade, the demographic groups most similar to Peruvians are Houma (95.1%, a difference of 0.0%), Immigrants from South America (95.1%, a difference of 0.0%), Immigrants from Uzbekistan (95.1%, a difference of 0.0%), Immigrants from Western Africa (95.1%, a difference of 0.010%), and Immigrants from Colombia (95.1%, a difference of 0.010%).
| Demographics | Rating | Rank | 7th Grade |
| Immigrants | Uruguay | 0.3 /100 | #265 | Tragic 95.2% |
| Immigrants | Ghana | 0.3 /100 | #266 | Tragic 95.2% |
| Yuman | 0.3 /100 | #267 | Tragic 95.2% |
| Immigrants | Hong Kong | 0.3 /100 | #268 | Tragic 95.2% |
| Trinidadians and Tobagonians | 0.3 /100 | #269 | Tragic 95.2% |
| Houma | 0.2 /100 | #270 | Tragic 95.1% |
| Immigrants | South America | 0.2 /100 | #271 | Tragic 95.1% |
| Peruvians | 0.2 /100 | #272 | Tragic 95.1% |
| Immigrants | Uzbekistan | 0.2 /100 | #273 | Tragic 95.1% |
| Immigrants | Western Africa | 0.2 /100 | #274 | Tragic 95.1% |
| Immigrants | Colombia | 0.2 /100 | #275 | Tragic 95.1% |
| Immigrants | Thailand | 0.2 /100 | #276 | Tragic 95.1% |
| Immigrants | Afghanistan | 0.2 /100 | #277 | Tragic 95.1% |
| Immigrants | Trinidad and Tobago | 0.1 /100 | #278 | Tragic 95.1% |
| Barbadians | 0.1 /100 | #279 | Tragic 95.1% |
Demographics Similar to Immigrants from Nicaragua by 7th Grade
In terms of 7th grade, the demographic groups most similar to Immigrants from Nicaragua are Immigrants from the Azores (93.0%, a difference of 0.040%), Immigrants from Dominican Republic (92.9%, a difference of 0.090%), Immigrants from Cabo Verde (93.1%, a difference of 0.13%), Honduran (92.9%, a difference of 0.13%), and Nepalese (93.2%, a difference of 0.20%).
| Demographics | Rating | Rank | 7th Grade |
| Belizeans | 0.0 /100 | #321 | Tragic 93.5% |
| Nicaraguans | 0.0 /100 | #322 | Tragic 93.5% |
| Immigrants | Belize | 0.0 /100 | #323 | Tragic 93.4% |
| Dominicans | 0.0 /100 | #324 | Tragic 93.3% |
| Central American Indians | 0.0 /100 | #325 | Tragic 93.3% |
| Nepalese | 0.0 /100 | #326 | Tragic 93.2% |
| Immigrants | Cabo Verde | 0.0 /100 | #327 | Tragic 93.1% |
| Immigrants | Nicaragua | 0.0 /100 | #328 | Tragic 93.0% |
| Immigrants | Azores | 0.0 /100 | #329 | Tragic 93.0% |
| Immigrants | Dominican Republic | 0.0 /100 | #330 | Tragic 92.9% |
| Hondurans | 0.0 /100 | #331 | Tragic 92.9% |
| Hispanics or Latinos | 0.0 /100 | #332 | Tragic 92.7% |
| Immigrants | Armenia | 0.0 /100 | #333 | Tragic 92.7% |
| Immigrants | Yemen | 0.0 /100 | #334 | Tragic 92.6% |
| Mexican American Indians | 0.0 /100 | #335 | Tragic 92.6% |