Laotian vs Immigrants from the Azores 9th Grade
COMPARE
Laotian
Immigrants from the Azores
9th Grade
9th Grade Comparison
Laotians
Immigrants from the Azores
94.6%
9TH GRADE
21.0/ 100
METRIC RATING
199th/ 347
METRIC RANK
90.8%
9TH GRADE
0.0/ 100
METRIC RATING
334th/ 347
METRIC RANK
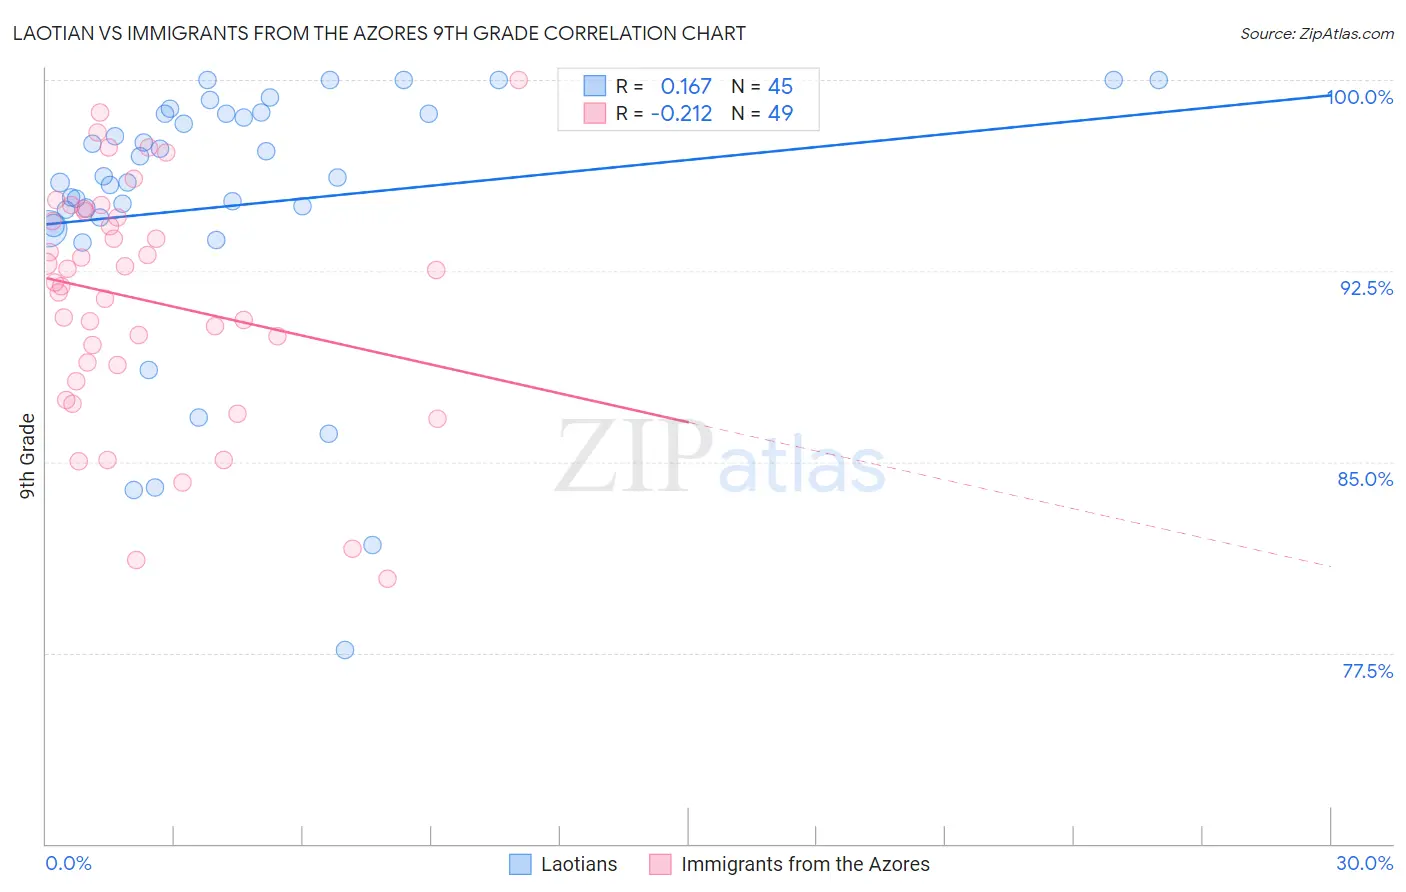
Laotian vs Immigrants from the Azores 9th Grade Correlation Chart
The statistical analysis conducted on geographies consisting of 224,856,886 people shows a poor positive correlation between the proportion of Laotians and percentage of population with at least 9th grade education in the United States with a correlation coefficient (R) of 0.167 and weighted average of 94.6%. Similarly, the statistical analysis conducted on geographies consisting of 46,257,310 people shows a weak negative correlation between the proportion of Immigrants from the Azores and percentage of population with at least 9th grade education in the United States with a correlation coefficient (R) of -0.212 and weighted average of 90.8%, a difference of 4.3%.
9th Grade Correlation Summary
| Measurement | Laotian | Immigrants from the Azores |
| Minimum | 77.6% | 80.4% |
| Maximum | 100.0% | 100.0% |
| Range | 22.4% | 19.6% |
| Mean | 95.1% | 91.3% |
| Median | 96.2% | 92.1% |
| Interquartile 25% (IQ1) | 94.4% | 88.5% |
| Interquartile 75% (IQ3) | 98.7% | 94.7% |
| Interquartile Range (IQR) | 4.2% | 6.3% |
| Standard Deviation (Sample) | 5.3% | 4.6% |
| Standard Deviation (Population) | 5.2% | 4.6% |
Similar Demographics by 9th Grade
Demographics Similar to Laotians by 9th Grade
In terms of 9th grade, the demographic groups most similar to Laotians are Immigrants from Zaire (94.6%, a difference of 0.0%), Black/African American (94.6%, a difference of 0.010%), Immigrants from Eastern Asia (94.6%, a difference of 0.010%), Immigrants from Bahamas (94.6%, a difference of 0.010%), and Hawaiian (94.7%, a difference of 0.020%).
| Demographics | Rating | Rank | 9th Grade |
| Immigrants | Northern Africa | 30.7 /100 | #192 | Fair 94.7% |
| Paraguayans | 30.1 /100 | #193 | Fair 94.7% |
| Panamanians | 29.0 /100 | #194 | Fair 94.7% |
| Marshallese | 27.9 /100 | #195 | Fair 94.7% |
| Immigrants | Lebanon | 27.2 /100 | #196 | Fair 94.7% |
| Immigrants | Micronesia | 24.7 /100 | #197 | Fair 94.7% |
| Hawaiians | 22.7 /100 | #198 | Fair 94.7% |
| Laotians | 21.0 /100 | #199 | Fair 94.6% |
| Immigrants | Zaire | 20.6 /100 | #200 | Fair 94.6% |
| Blacks/African Americans | 20.5 /100 | #201 | Fair 94.6% |
| Immigrants | Eastern Asia | 19.8 /100 | #202 | Poor 94.6% |
| Immigrants | Bahamas | 19.8 /100 | #203 | Poor 94.6% |
| Moroccans | 19.6 /100 | #204 | Poor 94.6% |
| Immigrants | Sudan | 17.6 /100 | #205 | Poor 94.6% |
| Samoans | 17.3 /100 | #206 | Poor 94.6% |
Demographics Similar to Immigrants from the Azores by 9th Grade
In terms of 9th grade, the demographic groups most similar to Immigrants from the Azores are Immigrants from Yemen (90.8%, a difference of 0.050%), Hispanic or Latino (90.9%, a difference of 0.14%), Mexican American Indian (90.9%, a difference of 0.16%), Immigrants from Honduras (90.6%, a difference of 0.17%), and Immigrants from Cabo Verde (90.9%, a difference of 0.19%).
| Demographics | Rating | Rank | 9th Grade |
| Immigrants | Nicaragua | 0.0 /100 | #327 | Tragic 91.3% |
| Dominicans | 0.0 /100 | #328 | Tragic 91.1% |
| Hondurans | 0.0 /100 | #329 | Tragic 91.0% |
| Immigrants | Cabo Verde | 0.0 /100 | #330 | Tragic 90.9% |
| Mexican American Indians | 0.0 /100 | #331 | Tragic 90.9% |
| Hispanics or Latinos | 0.0 /100 | #332 | Tragic 90.9% |
| Immigrants | Yemen | 0.0 /100 | #333 | Tragic 90.8% |
| Immigrants | Azores | 0.0 /100 | #334 | Tragic 90.8% |
| Immigrants | Honduras | 0.0 /100 | #335 | Tragic 90.6% |
| Immigrants | Dominican Republic | 0.0 /100 | #336 | Tragic 90.5% |
| Immigrants | Latin America | 0.0 /100 | #337 | Tragic 90.4% |
| Central Americans | 0.0 /100 | #338 | Tragic 90.4% |
| Yakama | 0.0 /100 | #339 | Tragic 90.1% |
| Mexicans | 0.0 /100 | #340 | Tragic 90.0% |
| Guatemalans | 0.0 /100 | #341 | Tragic 89.9% |