Maltese vs Immigrants from the Azores 9th Grade
COMPARE
Maltese
Immigrants from the Azores
9th Grade
9th Grade Comparison
Maltese
Immigrants from the Azores
96.3%
9TH GRADE
100.0/ 100
METRIC RATING
30th/ 347
METRIC RANK
90.8%
9TH GRADE
0.0/ 100
METRIC RATING
334th/ 347
METRIC RANK
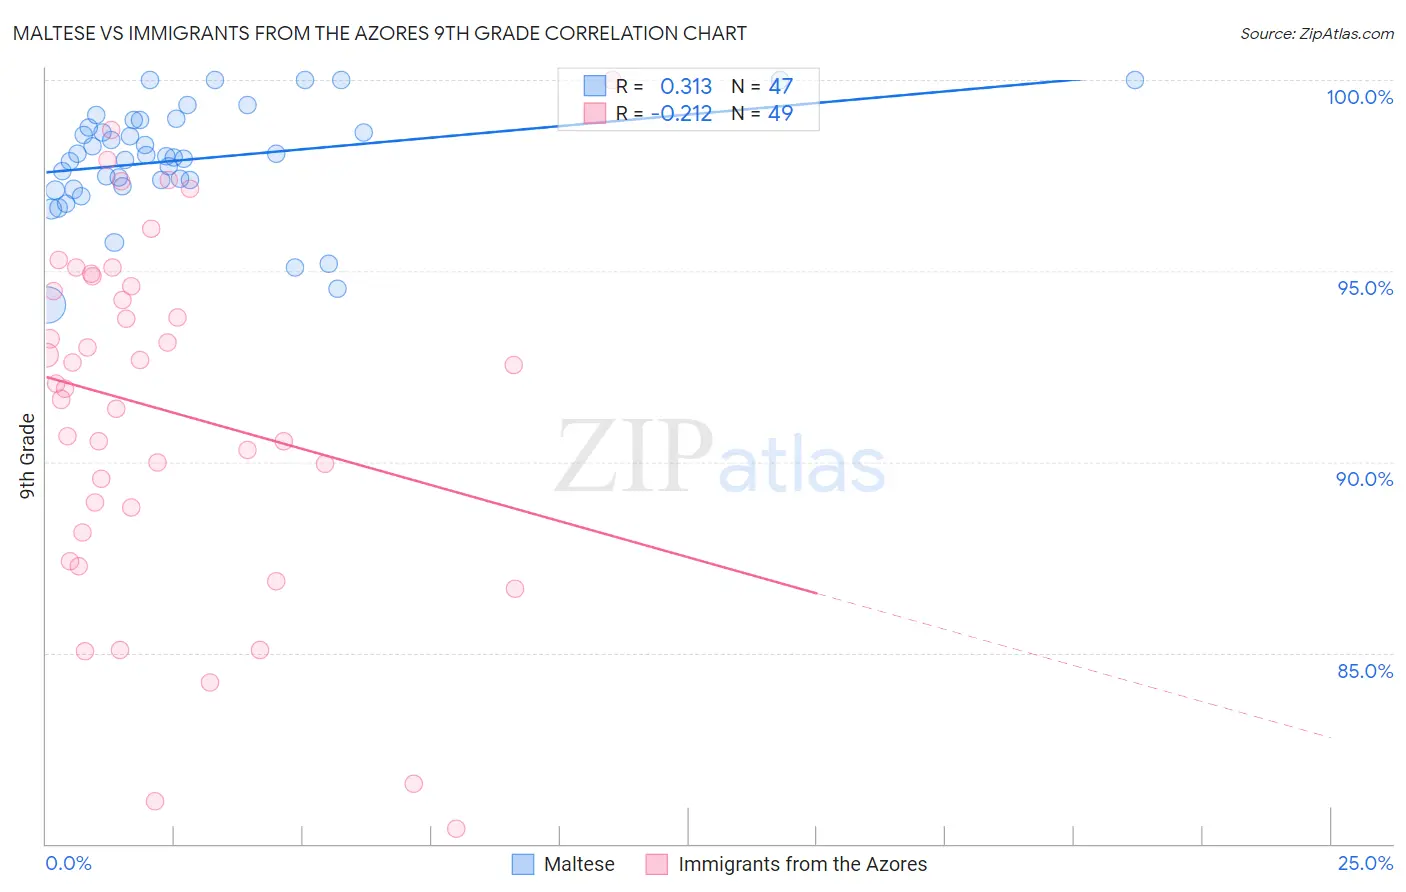
Maltese vs Immigrants from the Azores 9th Grade Correlation Chart
The statistical analysis conducted on geographies consisting of 126,476,608 people shows a mild positive correlation between the proportion of Maltese and percentage of population with at least 9th grade education in the United States with a correlation coefficient (R) of 0.313 and weighted average of 96.3%. Similarly, the statistical analysis conducted on geographies consisting of 46,257,310 people shows a weak negative correlation between the proportion of Immigrants from the Azores and percentage of population with at least 9th grade education in the United States with a correlation coefficient (R) of -0.212 and weighted average of 90.8%, a difference of 6.1%.
9th Grade Correlation Summary
| Measurement | Maltese | Immigrants from the Azores |
| Minimum | 94.1% | 80.4% |
| Maximum | 100.0% | 100.0% |
| Range | 5.9% | 19.6% |
| Mean | 97.9% | 91.3% |
| Median | 98.0% | 92.1% |
| Interquartile 25% (IQ1) | 97.2% | 88.5% |
| Interquartile 75% (IQ3) | 99.0% | 94.7% |
| Interquartile Range (IQR) | 1.7% | 6.3% |
| Standard Deviation (Sample) | 1.4% | 4.6% |
| Standard Deviation (Population) | 1.4% | 4.6% |
Similar Demographics by 9th Grade
Demographics Similar to Maltese by 9th Grade
In terms of 9th grade, the demographic groups most similar to Maltese are British (96.3%, a difference of 0.0%), Belgian (96.3%, a difference of 0.010%), Chinese (96.3%, a difference of 0.020%), Luxembourger (96.3%, a difference of 0.020%), and Scotch-Irish (96.3%, a difference of 0.030%).
| Demographics | Rating | Rank | 9th Grade |
| Czechs | 100.0 /100 | #23 | Exceptional 96.4% |
| Latvians | 100.0 /100 | #24 | Exceptional 96.4% |
| French | 100.0 /100 | #25 | Exceptional 96.3% |
| French Canadians | 100.0 /100 | #26 | Exceptional 96.3% |
| Scotch-Irish | 100.0 /100 | #27 | Exceptional 96.3% |
| Eastern Europeans | 100.0 /100 | #28 | Exceptional 96.3% |
| Chinese | 100.0 /100 | #29 | Exceptional 96.3% |
| Maltese | 100.0 /100 | #30 | Exceptional 96.3% |
| British | 100.0 /100 | #31 | Exceptional 96.3% |
| Belgians | 100.0 /100 | #32 | Exceptional 96.3% |
| Luxembourgers | 100.0 /100 | #33 | Exceptional 96.3% |
| Hungarians | 100.0 /100 | #34 | Exceptional 96.2% |
| Bulgarians | 99.9 /100 | #35 | Exceptional 96.2% |
| Northern Europeans | 99.9 /100 | #36 | Exceptional 96.2% |
| Estonians | 99.9 /100 | #37 | Exceptional 96.1% |
Demographics Similar to Immigrants from the Azores by 9th Grade
In terms of 9th grade, the demographic groups most similar to Immigrants from the Azores are Immigrants from Yemen (90.8%, a difference of 0.050%), Hispanic or Latino (90.9%, a difference of 0.14%), Mexican American Indian (90.9%, a difference of 0.16%), Immigrants from Honduras (90.6%, a difference of 0.17%), and Immigrants from Cabo Verde (90.9%, a difference of 0.19%).
| Demographics | Rating | Rank | 9th Grade |
| Immigrants | Nicaragua | 0.0 /100 | #327 | Tragic 91.3% |
| Dominicans | 0.0 /100 | #328 | Tragic 91.1% |
| Hondurans | 0.0 /100 | #329 | Tragic 91.0% |
| Immigrants | Cabo Verde | 0.0 /100 | #330 | Tragic 90.9% |
| Mexican American Indians | 0.0 /100 | #331 | Tragic 90.9% |
| Hispanics or Latinos | 0.0 /100 | #332 | Tragic 90.9% |
| Immigrants | Yemen | 0.0 /100 | #333 | Tragic 90.8% |
| Immigrants | Azores | 0.0 /100 | #334 | Tragic 90.8% |
| Immigrants | Honduras | 0.0 /100 | #335 | Tragic 90.6% |
| Immigrants | Dominican Republic | 0.0 /100 | #336 | Tragic 90.5% |
| Immigrants | Latin America | 0.0 /100 | #337 | Tragic 90.4% |
| Central Americans | 0.0 /100 | #338 | Tragic 90.4% |
| Yakama | 0.0 /100 | #339 | Tragic 90.1% |
| Mexicans | 0.0 /100 | #340 | Tragic 90.0% |
| Guatemalans | 0.0 /100 | #341 | Tragic 89.9% |