Mongolian vs Immigrants from the Azores 9th Grade
COMPARE
Mongolian
Immigrants from the Azores
9th Grade
9th Grade Comparison
Mongolians
Immigrants from the Azores
95.0%
9TH GRADE
73.0/ 100
METRIC RATING
157th/ 347
METRIC RANK
90.8%
9TH GRADE
0.0/ 100
METRIC RATING
334th/ 347
METRIC RANK
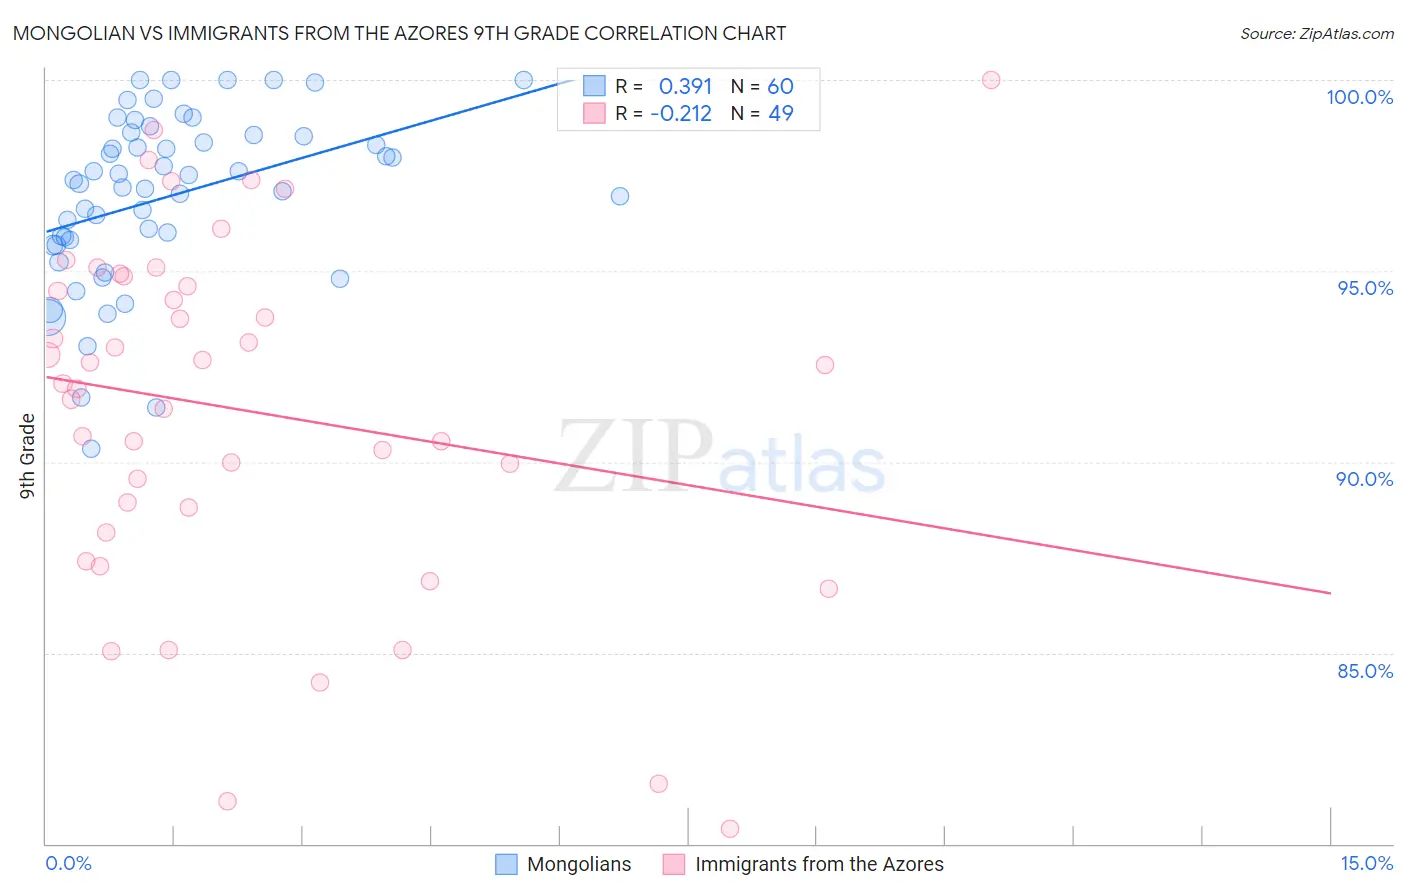
Mongolian vs Immigrants from the Azores 9th Grade Correlation Chart
The statistical analysis conducted on geographies consisting of 140,247,278 people shows a mild positive correlation between the proportion of Mongolians and percentage of population with at least 9th grade education in the United States with a correlation coefficient (R) of 0.391 and weighted average of 95.0%. Similarly, the statistical analysis conducted on geographies consisting of 46,257,310 people shows a weak negative correlation between the proportion of Immigrants from the Azores and percentage of population with at least 9th grade education in the United States with a correlation coefficient (R) of -0.212 and weighted average of 90.8%, a difference of 4.7%.
9th Grade Correlation Summary
| Measurement | Mongolian | Immigrants from the Azores |
| Minimum | 90.4% | 80.4% |
| Maximum | 100.0% | 100.0% |
| Range | 9.6% | 19.6% |
| Mean | 96.9% | 91.3% |
| Median | 97.3% | 92.1% |
| Interquartile 25% (IQ1) | 95.7% | 88.5% |
| Interquartile 75% (IQ3) | 98.6% | 94.7% |
| Interquartile Range (IQR) | 2.8% | 6.3% |
| Standard Deviation (Sample) | 2.2% | 4.6% |
| Standard Deviation (Population) | 2.2% | 4.6% |
Similar Demographics by 9th Grade
Demographics Similar to Mongolians by 9th Grade
In terms of 9th grade, the demographic groups most similar to Mongolians are Immigrants from Kenya (95.0%, a difference of 0.0%), Arab (95.1%, a difference of 0.020%), Immigrants from Kazakhstan (95.1%, a difference of 0.020%), Albanian (95.1%, a difference of 0.030%), and Egyptian (95.0%, a difference of 0.030%).
| Demographics | Rating | Rank | 9th Grade |
| Kenyans | 79.1 /100 | #150 | Good 95.1% |
| Cajuns | 77.3 /100 | #151 | Good 95.1% |
| Ugandans | 77.0 /100 | #152 | Good 95.1% |
| Albanians | 76.1 /100 | #153 | Good 95.1% |
| Arabs | 74.9 /100 | #154 | Good 95.1% |
| Immigrants | Kazakhstan | 74.7 /100 | #155 | Good 95.1% |
| Immigrants | Kenya | 73.1 /100 | #156 | Good 95.0% |
| Mongolians | 73.0 /100 | #157 | Good 95.0% |
| Egyptians | 70.1 /100 | #158 | Good 95.0% |
| Immigrants | Ukraine | 67.4 /100 | #159 | Good 95.0% |
| Immigrants | Italy | 66.6 /100 | #160 | Good 95.0% |
| French American Indians | 66.5 /100 | #161 | Good 95.0% |
| Bermudans | 65.8 /100 | #162 | Good 95.0% |
| Pakistanis | 64.1 /100 | #163 | Good 95.0% |
| Venezuelans | 63.6 /100 | #164 | Good 95.0% |
Demographics Similar to Immigrants from the Azores by 9th Grade
In terms of 9th grade, the demographic groups most similar to Immigrants from the Azores are Immigrants from Yemen (90.8%, a difference of 0.050%), Hispanic or Latino (90.9%, a difference of 0.14%), Mexican American Indian (90.9%, a difference of 0.16%), Immigrants from Honduras (90.6%, a difference of 0.17%), and Immigrants from Cabo Verde (90.9%, a difference of 0.19%).
| Demographics | Rating | Rank | 9th Grade |
| Immigrants | Nicaragua | 0.0 /100 | #327 | Tragic 91.3% |
| Dominicans | 0.0 /100 | #328 | Tragic 91.1% |
| Hondurans | 0.0 /100 | #329 | Tragic 91.0% |
| Immigrants | Cabo Verde | 0.0 /100 | #330 | Tragic 90.9% |
| Mexican American Indians | 0.0 /100 | #331 | Tragic 90.9% |
| Hispanics or Latinos | 0.0 /100 | #332 | Tragic 90.9% |
| Immigrants | Yemen | 0.0 /100 | #333 | Tragic 90.8% |
| Immigrants | Azores | 0.0 /100 | #334 | Tragic 90.8% |
| Immigrants | Honduras | 0.0 /100 | #335 | Tragic 90.6% |
| Immigrants | Dominican Republic | 0.0 /100 | #336 | Tragic 90.5% |
| Immigrants | Latin America | 0.0 /100 | #337 | Tragic 90.4% |
| Central Americans | 0.0 /100 | #338 | Tragic 90.4% |
| Yakama | 0.0 /100 | #339 | Tragic 90.1% |
| Mexicans | 0.0 /100 | #340 | Tragic 90.0% |
| Guatemalans | 0.0 /100 | #341 | Tragic 89.9% |