Immigrants from Serbia vs Immigrants from Sweden GED/Equivalency
COMPARE
Immigrants from Serbia
Immigrants from Sweden
GED/Equivalency
GED/Equivalency Comparison
Immigrants from Serbia
Immigrants from Sweden
87.7%
GED/EQUIVALENCY
98.7/ 100
METRIC RATING
76th/ 347
METRIC RANK
88.4%
GED/EQUIVALENCY
99.7/ 100
METRIC RATING
33rd/ 347
METRIC RANK
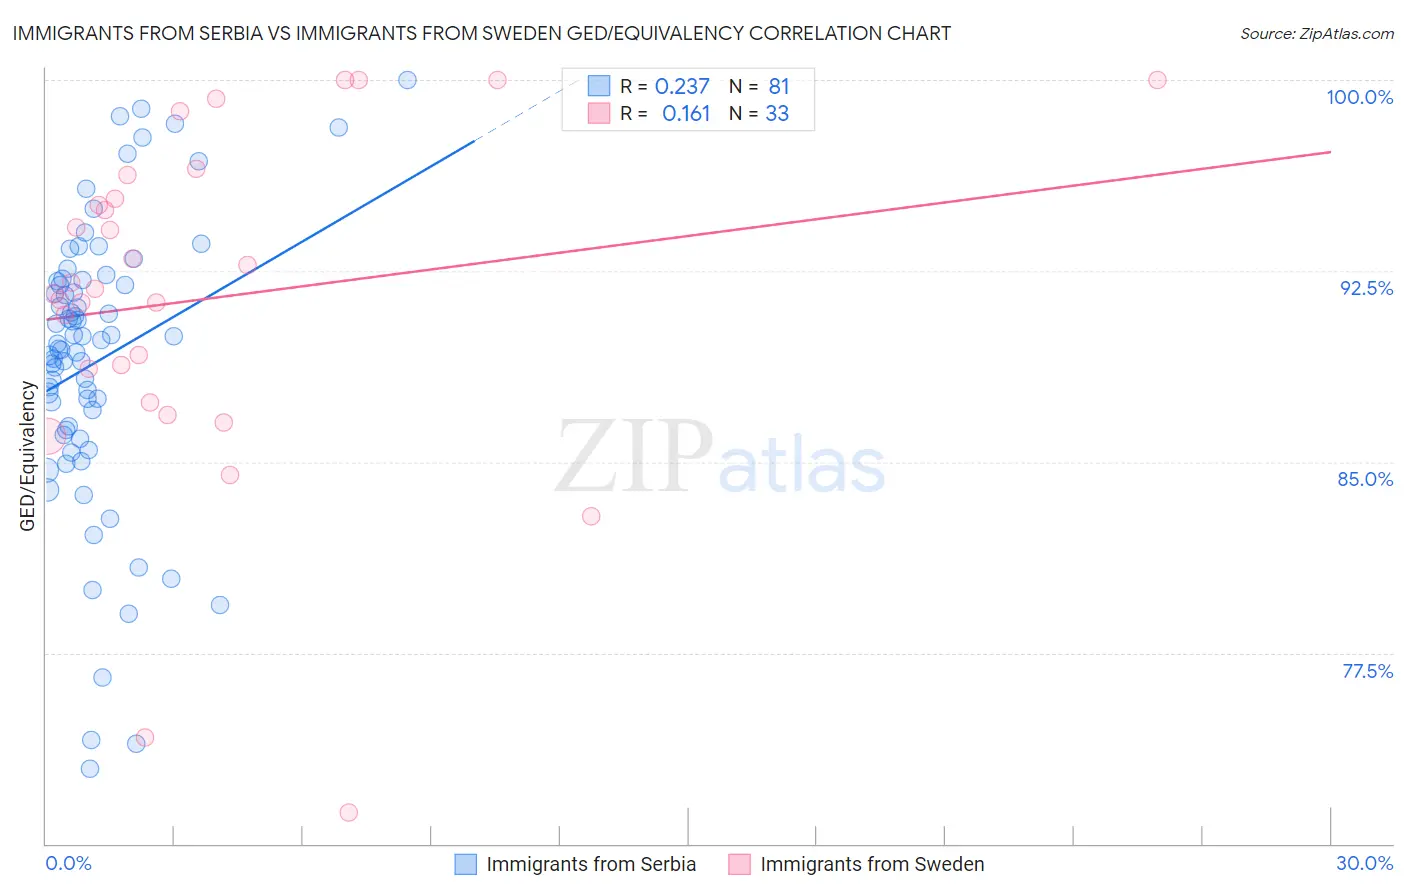
Immigrants from Serbia vs Immigrants from Sweden GED/Equivalency Correlation Chart
The statistical analysis conducted on geographies consisting of 131,746,424 people shows a weak positive correlation between the proportion of Immigrants from Serbia and percentage of population with at least ged/equivalency education in the United States with a correlation coefficient (R) of 0.237 and weighted average of 87.7%. Similarly, the statistical analysis conducted on geographies consisting of 164,737,092 people shows a poor positive correlation between the proportion of Immigrants from Sweden and percentage of population with at least ged/equivalency education in the United States with a correlation coefficient (R) of 0.161 and weighted average of 88.4%, a difference of 0.83%.
GED/Equivalency Correlation Summary
| Measurement | Immigrants from Serbia | Immigrants from Sweden |
| Minimum | 72.9% | 71.2% |
| Maximum | 100.0% | 100.0% |
| Range | 27.1% | 28.8% |
| Mean | 88.9% | 91.4% |
| Median | 89.6% | 91.8% |
| Interquartile 25% (IQ1) | 86.2% | 88.0% |
| Interquartile 75% (IQ3) | 92.1% | 95.8% |
| Interquartile Range (IQR) | 6.0% | 7.8% |
| Standard Deviation (Sample) | 5.6% | 6.8% |
| Standard Deviation (Population) | 5.6% | 6.6% |
Similar Demographics by GED/Equivalency
Demographics Similar to Immigrants from Serbia by GED/Equivalency
In terms of ged/equivalency, the demographic groups most similar to Immigrants from Serbia are Scottish (87.7%, a difference of 0.010%), Slavic (87.7%, a difference of 0.010%), Immigrants from Kuwait (87.7%, a difference of 0.030%), Irish (87.6%, a difference of 0.030%), and Belgian (87.7%, a difference of 0.050%).
| Demographics | Rating | Rank | GED/Equivalency |
| Immigrants | Saudi Arabia | 99.0 /100 | #69 | Exceptional 87.8% |
| Ukrainians | 98.8 /100 | #70 | Exceptional 87.7% |
| Austrians | 98.8 /100 | #71 | Exceptional 87.7% |
| Immigrants | Moldova | 98.8 /100 | #72 | Exceptional 87.7% |
| Belgians | 98.8 /100 | #73 | Exceptional 87.7% |
| Immigrants | Kuwait | 98.8 /100 | #74 | Exceptional 87.7% |
| Scottish | 98.7 /100 | #75 | Exceptional 87.7% |
| Immigrants | Serbia | 98.7 /100 | #76 | Exceptional 87.7% |
| Slavs | 98.7 /100 | #77 | Exceptional 87.7% |
| Irish | 98.6 /100 | #78 | Exceptional 87.6% |
| English | 98.6 /100 | #79 | Exceptional 87.6% |
| Immigrants | England | 98.5 /100 | #80 | Exceptional 87.6% |
| Immigrants | Sri Lanka | 98.3 /100 | #81 | Exceptional 87.5% |
| Romanians | 98.3 /100 | #82 | Exceptional 87.5% |
| South Africans | 98.3 /100 | #83 | Exceptional 87.5% |
Demographics Similar to Immigrants from Sweden by GED/Equivalency
In terms of ged/equivalency, the demographic groups most similar to Immigrants from Sweden are Immigrants from Japan (88.4%, a difference of 0.010%), Immigrants from South Central Asia (88.4%, a difference of 0.020%), Danish (88.4%, a difference of 0.040%), Immigrants from Belgium (88.3%, a difference of 0.050%), and Bhutanese (88.4%, a difference of 0.060%).
| Demographics | Rating | Rank | GED/Equivalency |
| Immigrants | Australia | 99.8 /100 | #26 | Exceptional 88.6% |
| Immigrants | Lithuania | 99.8 /100 | #27 | Exceptional 88.6% |
| Immigrants | Northern Europe | 99.8 /100 | #28 | Exceptional 88.5% |
| Poles | 99.8 /100 | #29 | Exceptional 88.5% |
| Turks | 99.8 /100 | #30 | Exceptional 88.5% |
| Bhutanese | 99.8 /100 | #31 | Exceptional 88.4% |
| Danes | 99.8 /100 | #32 | Exceptional 88.4% |
| Immigrants | Sweden | 99.7 /100 | #33 | Exceptional 88.4% |
| Immigrants | Japan | 99.7 /100 | #34 | Exceptional 88.4% |
| Immigrants | South Central Asia | 99.7 /100 | #35 | Exceptional 88.4% |
| Immigrants | Belgium | 99.7 /100 | #36 | Exceptional 88.3% |
| Immigrants | Austria | 99.7 /100 | #37 | Exceptional 88.3% |
| Burmese | 99.7 /100 | #38 | Exceptional 88.3% |
| Immigrants | Israel | 99.6 /100 | #39 | Exceptional 88.2% |
| Italians | 99.6 /100 | #40 | Exceptional 88.2% |