Pennsylvania German vs Immigrants from Sweden Disability Age 65 to 74
COMPARE
Pennsylvania German
Immigrants from Sweden
Disability Age 65 to 74
Disability Age 65 to 74 Comparison
Pennsylvania Germans
Immigrants from Sweden
24.0%
DISABILITY AGE 65 TO 74
13.3/ 100
METRIC RATING
215th/ 347
METRIC RANK
21.0%
DISABILITY AGE 65 TO 74
99.9/ 100
METRIC RATING
27th/ 347
METRIC RANK
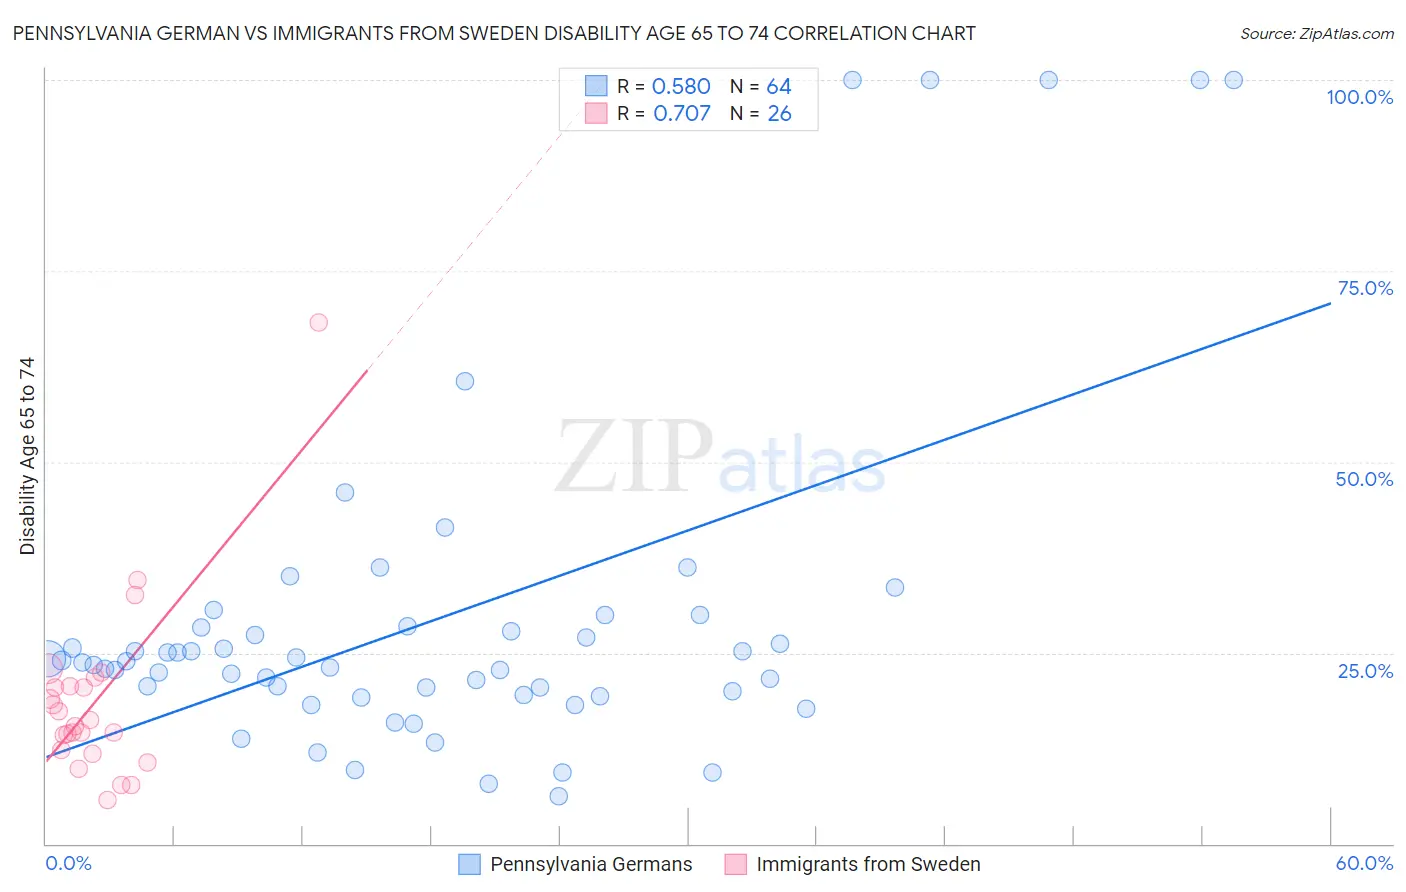
Pennsylvania German vs Immigrants from Sweden Disability Age 65 to 74 Correlation Chart
The statistical analysis conducted on geographies consisting of 233,928,822 people shows a substantial positive correlation between the proportion of Pennsylvania Germans and percentage of population with a disability between the ages 65 and 75 in the United States with a correlation coefficient (R) of 0.580 and weighted average of 24.0%. Similarly, the statistical analysis conducted on geographies consisting of 164,619,095 people shows a strong positive correlation between the proportion of Immigrants from Sweden and percentage of population with a disability between the ages 65 and 75 in the United States with a correlation coefficient (R) of 0.707 and weighted average of 21.0%, a difference of 14.3%.
Disability Age 65 to 74 Correlation Summary
| Measurement | Pennsylvania German | Immigrants from Sweden |
| Minimum | 6.3% | 5.7% |
| Maximum | 100.0% | 68.2% |
| Range | 93.7% | 62.5% |
| Mean | 29.6% | 18.8% |
| Median | 23.8% | 15.8% |
| Interquartile 25% (IQ1) | 19.7% | 12.3% |
| Interquartile 75% (IQ3) | 28.4% | 20.7% |
| Interquartile Range (IQR) | 8.6% | 8.4% |
| Standard Deviation (Sample) | 22.4% | 12.2% |
| Standard Deviation (Population) | 22.3% | 11.9% |
Similar Demographics by Disability Age 65 to 74
Demographics Similar to Pennsylvania Germans by Disability Age 65 to 74
In terms of disability age 65 to 74, the demographic groups most similar to Pennsylvania Germans are Immigrants from Oceania (24.0%, a difference of 0.040%), Nicaraguan (23.9%, a difference of 0.12%), Jamaican (24.0%, a difference of 0.13%), Immigrants from Portugal (24.0%, a difference of 0.20%), and Immigrants from Nigeria (24.0%, a difference of 0.20%).
| Demographics | Rating | Rank | Disability Age 65 to 74 |
| Immigrants | Barbados | 19.6 /100 | #208 | Poor 23.8% |
| Immigrants | Kenya | 19.6 /100 | #209 | Poor 23.8% |
| Trinidadians and Tobagonians | 16.4 /100 | #210 | Poor 23.9% |
| Immigrants | West Indies | 15.9 /100 | #211 | Poor 23.9% |
| French | 15.7 /100 | #212 | Poor 23.9% |
| Nicaraguans | 14.3 /100 | #213 | Poor 23.9% |
| Immigrants | Oceania | 13.6 /100 | #214 | Poor 24.0% |
| Pennsylvania Germans | 13.3 /100 | #215 | Poor 24.0% |
| Jamaicans | 12.2 /100 | #216 | Poor 24.0% |
| Immigrants | Portugal | 11.7 /100 | #217 | Poor 24.0% |
| Immigrants | Nigeria | 11.7 /100 | #218 | Poor 24.0% |
| Immigrants | Burma/Myanmar | 11.6 /100 | #219 | Poor 24.0% |
| Ghanaians | 10.4 /100 | #220 | Poor 24.1% |
| Immigrants | Nicaragua | 9.8 /100 | #221 | Tragic 24.1% |
| Native Hawaiians | 9.3 /100 | #222 | Tragic 24.1% |
Demographics Similar to Immigrants from Sweden by Disability Age 65 to 74
In terms of disability age 65 to 74, the demographic groups most similar to Immigrants from Sweden are Immigrants from Australia (21.0%, a difference of 0.020%), Bolivian (21.0%, a difference of 0.030%), Soviet Union (21.0%, a difference of 0.080%), Immigrants from Czechoslovakia (21.0%, a difference of 0.10%), and Immigrants from Belgium (21.0%, a difference of 0.12%).
| Demographics | Rating | Rank | Disability Age 65 to 74 |
| Okinawans | 100.0 /100 | #20 | Exceptional 20.7% |
| Immigrants | Bolivia | 99.9 /100 | #21 | Exceptional 20.8% |
| Immigrants | Iran | 99.9 /100 | #22 | Exceptional 20.9% |
| Immigrants | Belgium | 99.9 /100 | #23 | Exceptional 21.0% |
| Soviet Union | 99.9 /100 | #24 | Exceptional 21.0% |
| Bolivians | 99.9 /100 | #25 | Exceptional 21.0% |
| Immigrants | Australia | 99.9 /100 | #26 | Exceptional 21.0% |
| Immigrants | Sweden | 99.9 /100 | #27 | Exceptional 21.0% |
| Immigrants | Czechoslovakia | 99.9 /100 | #28 | Exceptional 21.0% |
| Immigrants | Japan | 99.9 /100 | #29 | Exceptional 21.0% |
| Immigrants | Greece | 99.9 /100 | #30 | Exceptional 21.0% |
| Immigrants | Northern Europe | 99.9 /100 | #31 | Exceptional 21.0% |
| Turks | 99.9 /100 | #32 | Exceptional 21.0% |
| Immigrants | Argentina | 99.9 /100 | #33 | Exceptional 21.1% |
| Immigrants | Sri Lanka | 99.9 /100 | #34 | Exceptional 21.1% |