Soviet Union vs Immigrants from Sweden GED/Equivalency
COMPARE
Soviet Union
Immigrants from Sweden
GED/Equivalency
GED/Equivalency Comparison
Soviet Union
Immigrants from Sweden
88.0%
GED/EQUIVALENCY
99.4/ 100
METRIC RATING
54th/ 347
METRIC RANK
88.4%
GED/EQUIVALENCY
99.7/ 100
METRIC RATING
33rd/ 347
METRIC RANK
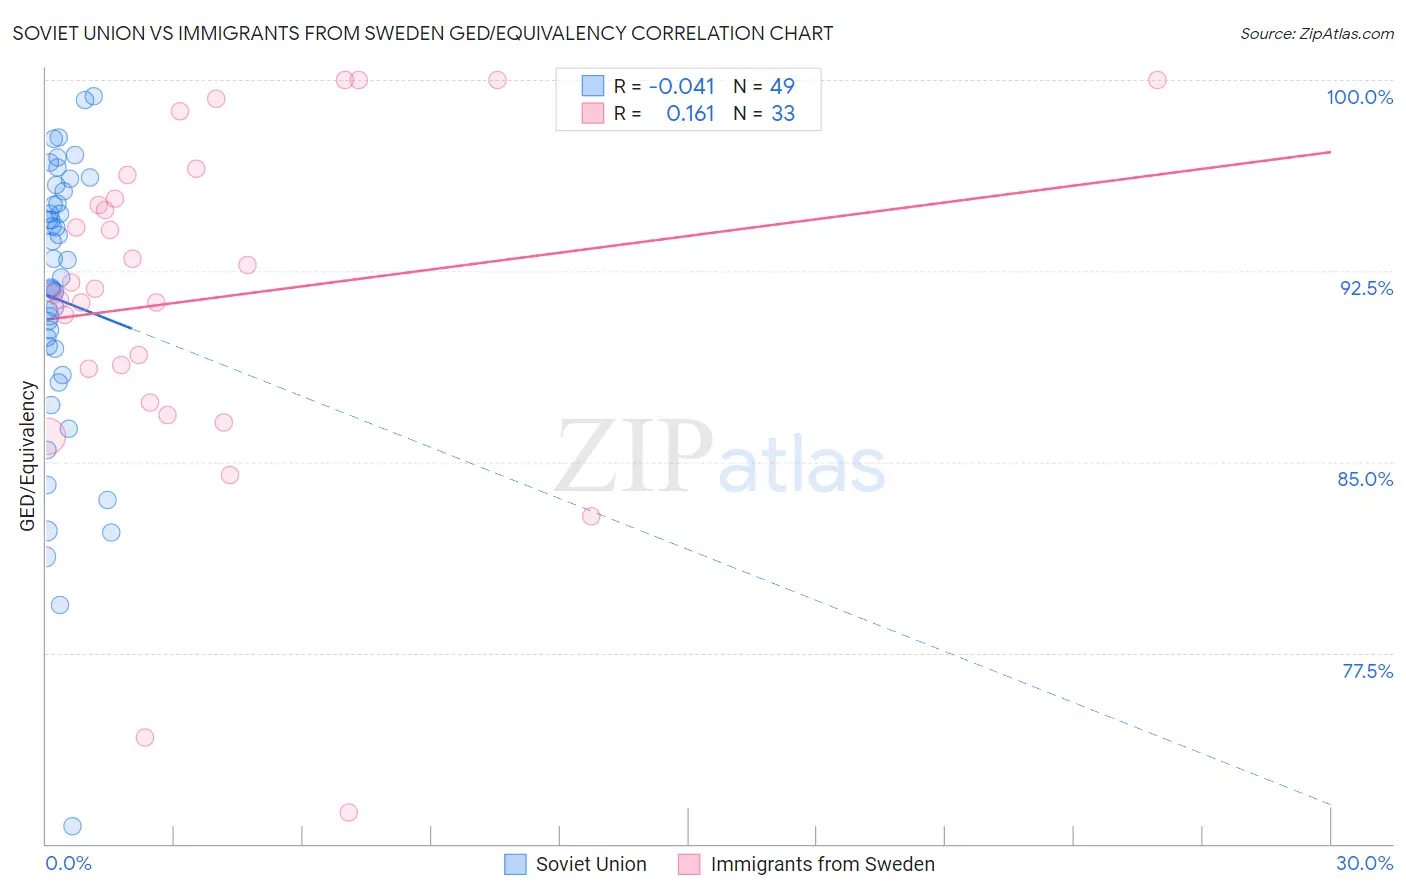
Soviet Union vs Immigrants from Sweden GED/Equivalency Correlation Chart
The statistical analysis conducted on geographies consisting of 43,454,395 people shows no correlation between the proportion of Soviet Union and percentage of population with at least ged/equivalency education in the United States with a correlation coefficient (R) of -0.041 and weighted average of 88.0%. Similarly, the statistical analysis conducted on geographies consisting of 164,737,092 people shows a poor positive correlation between the proportion of Immigrants from Sweden and percentage of population with at least ged/equivalency education in the United States with a correlation coefficient (R) of 0.161 and weighted average of 88.4%, a difference of 0.45%.
GED/Equivalency Correlation Summary
| Measurement | Soviet Union | Immigrants from Sweden |
| Minimum | 70.7% | 71.2% |
| Maximum | 99.4% | 100.0% |
| Range | 28.7% | 28.8% |
| Mean | 91.4% | 91.4% |
| Median | 92.2% | 91.8% |
| Interquartile 25% (IQ1) | 88.9% | 88.0% |
| Interquartile 75% (IQ3) | 95.4% | 95.8% |
| Interquartile Range (IQR) | 6.5% | 7.8% |
| Standard Deviation (Sample) | 5.7% | 6.8% |
| Standard Deviation (Population) | 5.7% | 6.6% |
Similar Demographics by GED/Equivalency
Demographics Similar to Soviet Union by GED/Equivalency
In terms of ged/equivalency, the demographic groups most similar to Soviet Union are New Zealander (88.0%, a difference of 0.0%), Immigrants from Netherlands (88.0%, a difference of 0.010%), Zimbabwean (88.0%, a difference of 0.010%), Immigrants from South Africa (88.0%, a difference of 0.010%), and Immigrants from Denmark (88.0%, a difference of 0.020%).
| Demographics | Rating | Rank | GED/Equivalency |
| Immigrants | Latvia | 99.5 /100 | #47 | Exceptional 88.1% |
| Greeks | 99.5 /100 | #48 | Exceptional 88.1% |
| Australians | 99.5 /100 | #49 | Exceptional 88.1% |
| Immigrants | Korea | 99.5 /100 | #50 | Exceptional 88.1% |
| Immigrants | Netherlands | 99.4 /100 | #51 | Exceptional 88.0% |
| Zimbabweans | 99.4 /100 | #52 | Exceptional 88.0% |
| Immigrants | South Africa | 99.4 /100 | #53 | Exceptional 88.0% |
| Soviet Union | 99.4 /100 | #54 | Exceptional 88.0% |
| New Zealanders | 99.4 /100 | #55 | Exceptional 88.0% |
| Immigrants | Denmark | 99.4 /100 | #56 | Exceptional 88.0% |
| Immigrants | Czechoslovakia | 99.3 /100 | #57 | Exceptional 87.9% |
| Northern Europeans | 99.3 /100 | #58 | Exceptional 87.9% |
| Serbians | 99.3 /100 | #59 | Exceptional 87.9% |
| Scandinavians | 99.3 /100 | #60 | Exceptional 87.9% |
| Europeans | 99.3 /100 | #61 | Exceptional 87.9% |
Demographics Similar to Immigrants from Sweden by GED/Equivalency
In terms of ged/equivalency, the demographic groups most similar to Immigrants from Sweden are Immigrants from Japan (88.4%, a difference of 0.010%), Immigrants from South Central Asia (88.4%, a difference of 0.020%), Danish (88.4%, a difference of 0.040%), Immigrants from Belgium (88.3%, a difference of 0.050%), and Bhutanese (88.4%, a difference of 0.060%).
| Demographics | Rating | Rank | GED/Equivalency |
| Immigrants | Australia | 99.8 /100 | #26 | Exceptional 88.6% |
| Immigrants | Lithuania | 99.8 /100 | #27 | Exceptional 88.6% |
| Immigrants | Northern Europe | 99.8 /100 | #28 | Exceptional 88.5% |
| Poles | 99.8 /100 | #29 | Exceptional 88.5% |
| Turks | 99.8 /100 | #30 | Exceptional 88.5% |
| Bhutanese | 99.8 /100 | #31 | Exceptional 88.4% |
| Danes | 99.8 /100 | #32 | Exceptional 88.4% |
| Immigrants | Sweden | 99.7 /100 | #33 | Exceptional 88.4% |
| Immigrants | Japan | 99.7 /100 | #34 | Exceptional 88.4% |
| Immigrants | South Central Asia | 99.7 /100 | #35 | Exceptional 88.4% |
| Immigrants | Belgium | 99.7 /100 | #36 | Exceptional 88.3% |
| Immigrants | Austria | 99.7 /100 | #37 | Exceptional 88.3% |
| Burmese | 99.7 /100 | #38 | Exceptional 88.3% |
| Immigrants | Israel | 99.6 /100 | #39 | Exceptional 88.2% |
| Italians | 99.6 /100 | #40 | Exceptional 88.2% |