Paraguayan vs Vietnamese No Schooling Completed
COMPARE
Paraguayan
Vietnamese
No Schooling Completed
No Schooling Completed Comparison
Paraguayans
Vietnamese
2.2%
NO SCHOOLING COMPLETED
29.3/ 100
METRIC RATING
193rd/ 347
METRIC RANK
3.2%
NO SCHOOLING COMPLETED
0.0/ 100
METRIC RATING
323rd/ 347
METRIC RANK
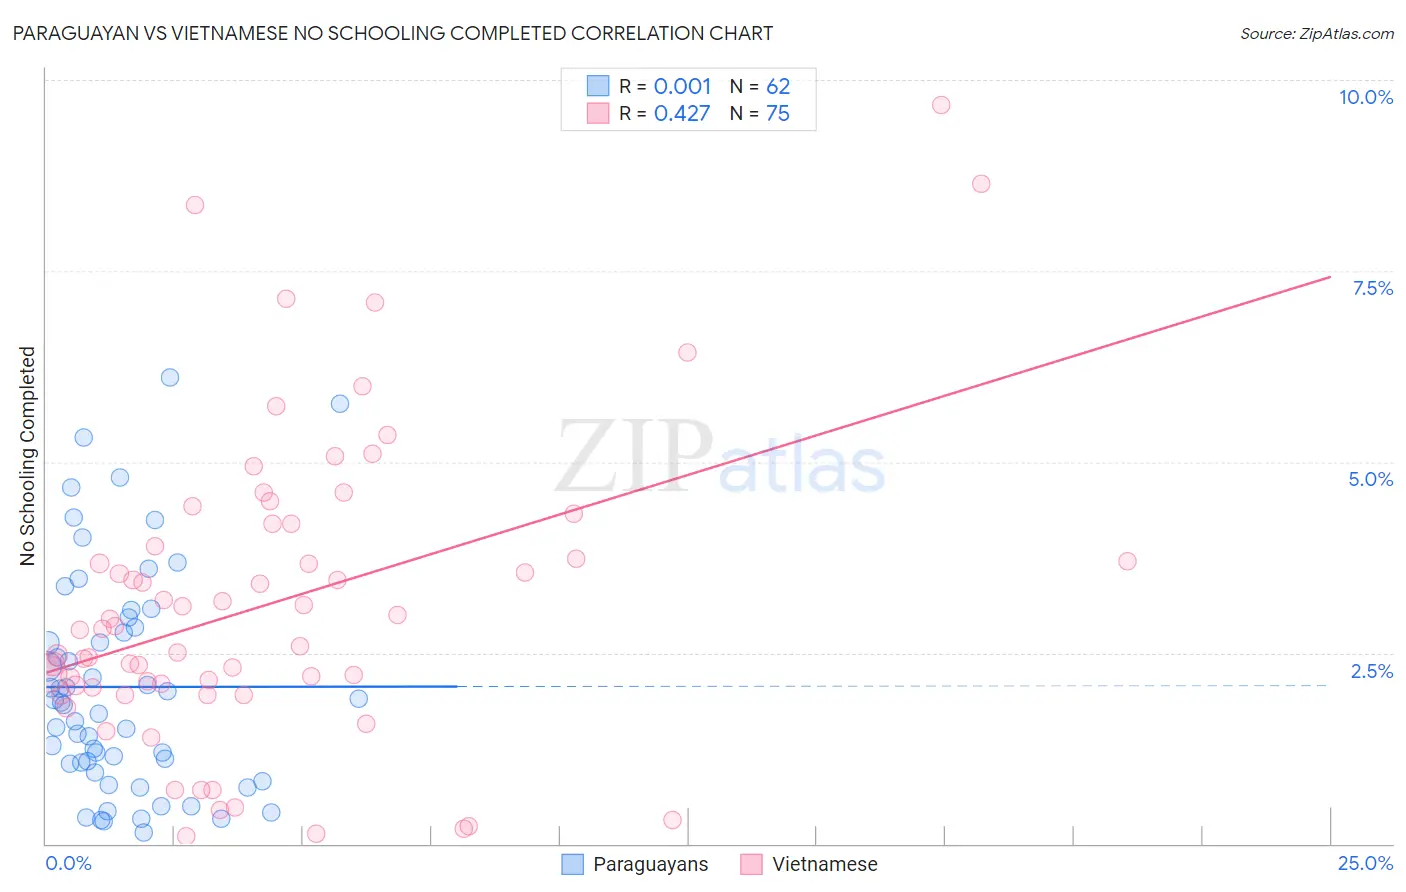
Paraguayan vs Vietnamese No Schooling Completed Correlation Chart
The statistical analysis conducted on geographies consisting of 94,864,851 people shows no correlation between the proportion of Paraguayans and percentage of population with no schooling in the United States with a correlation coefficient (R) of 0.001 and weighted average of 2.2%. Similarly, the statistical analysis conducted on geographies consisting of 170,340,562 people shows a moderate positive correlation between the proportion of Vietnamese and percentage of population with no schooling in the United States with a correlation coefficient (R) of 0.427 and weighted average of 3.2%, a difference of 47.5%.
No Schooling Completed Correlation Summary
| Measurement | Paraguayan | Vietnamese |
| Minimum | 0.14% | 0.099% |
| Maximum | 6.1% | 9.7% |
| Range | 6.0% | 9.6% |
| Mean | 2.1% | 3.1% |
| Median | 1.8% | 2.8% |
| Interquartile 25% (IQ1) | 1.0% | 2.0% |
| Interquartile 75% (IQ3) | 2.8% | 4.2% |
| Interquartile Range (IQR) | 1.8% | 2.1% |
| Standard Deviation (Sample) | 1.5% | 2.0% |
| Standard Deviation (Population) | 1.4% | 2.0% |
Similar Demographics by No Schooling Completed
Demographics Similar to Paraguayans by No Schooling Completed
In terms of no schooling completed, the demographic groups most similar to Paraguayans are Guamanian/Chamorro (2.2%, a difference of 0.080%), Immigrants from Albania (2.2%, a difference of 0.17%), Bermudan (2.1%, a difference of 0.21%), Hawaiian (2.2%, a difference of 0.37%), and Spanish American (2.1%, a difference of 0.51%).
| Demographics | Rating | Rank | No Schooling Completed |
| Immigrants | Bosnia and Herzegovina | 38.6 /100 | #186 | Fair 2.1% |
| Navajo | 36.5 /100 | #187 | Fair 2.1% |
| Immigrants | Kenya | 36.2 /100 | #188 | Fair 2.1% |
| Immigrants | Egypt | 36.1 /100 | #189 | Fair 2.1% |
| Spanish Americans | 32.6 /100 | #190 | Fair 2.1% |
| Bermudans | 30.7 /100 | #191 | Fair 2.1% |
| Guamanians/Chamorros | 29.8 /100 | #192 | Fair 2.2% |
| Paraguayans | 29.3 /100 | #193 | Fair 2.2% |
| Immigrants | Albania | 28.3 /100 | #194 | Fair 2.2% |
| Hawaiians | 27.0 /100 | #195 | Fair 2.2% |
| Immigrants | Ukraine | 26.1 /100 | #196 | Fair 2.2% |
| Immigrants | Southern Europe | 23.8 /100 | #197 | Fair 2.2% |
| Immigrants | Chile | 22.7 /100 | #198 | Fair 2.2% |
| Africans | 21.8 /100 | #199 | Fair 2.2% |
| Immigrants | Northern Africa | 19.5 /100 | #200 | Poor 2.2% |
Demographics Similar to Vietnamese by No Schooling Completed
In terms of no schooling completed, the demographic groups most similar to Vietnamese are Immigrants from Honduras (3.2%, a difference of 0.19%), Mexican American Indian (3.2%, a difference of 0.34%), Immigrants from Laos (3.1%, a difference of 0.86%), Immigrants from Bangladesh (3.1%, a difference of 0.98%), and Immigrants from Burma/Myanmar (3.1%, a difference of 1.0%).
| Demographics | Rating | Rank | No Schooling Completed |
| Immigrants | Ecuador | 0.0 /100 | #316 | Tragic 3.1% |
| Cape Verdeans | 0.0 /100 | #317 | Tragic 3.1% |
| Immigrants | Guyana | 0.0 /100 | #318 | Tragic 3.1% |
| Immigrants | Burma/Myanmar | 0.0 /100 | #319 | Tragic 3.1% |
| Immigrants | Bangladesh | 0.0 /100 | #320 | Tragic 3.1% |
| Immigrants | Laos | 0.0 /100 | #321 | Tragic 3.1% |
| Immigrants | Honduras | 0.0 /100 | #322 | Tragic 3.2% |
| Vietnamese | 0.0 /100 | #323 | Tragic 3.2% |
| Mexican American Indians | 0.0 /100 | #324 | Tragic 3.2% |
| Dominicans | 0.0 /100 | #325 | Tragic 3.2% |
| Indonesians | 0.0 /100 | #326 | Tragic 3.2% |
| Immigrants | Latin America | 0.0 /100 | #327 | Tragic 3.3% |
| Mexicans | 0.0 /100 | #328 | Tragic 3.3% |
| Immigrants | Vietnam | 0.0 /100 | #329 | Tragic 3.3% |
| Immigrants | Armenia | 0.0 /100 | #330 | Tragic 3.3% |