Immigrants from Israel vs Vietnamese No Schooling Completed
COMPARE
Immigrants from Israel
Vietnamese
No Schooling Completed
No Schooling Completed Comparison
Immigrants from Israel
Vietnamese
2.0%
NO SCHOOLING COMPLETED
85.4/ 100
METRIC RATING
138th/ 347
METRIC RANK
3.2%
NO SCHOOLING COMPLETED
0.0/ 100
METRIC RATING
323rd/ 347
METRIC RANK
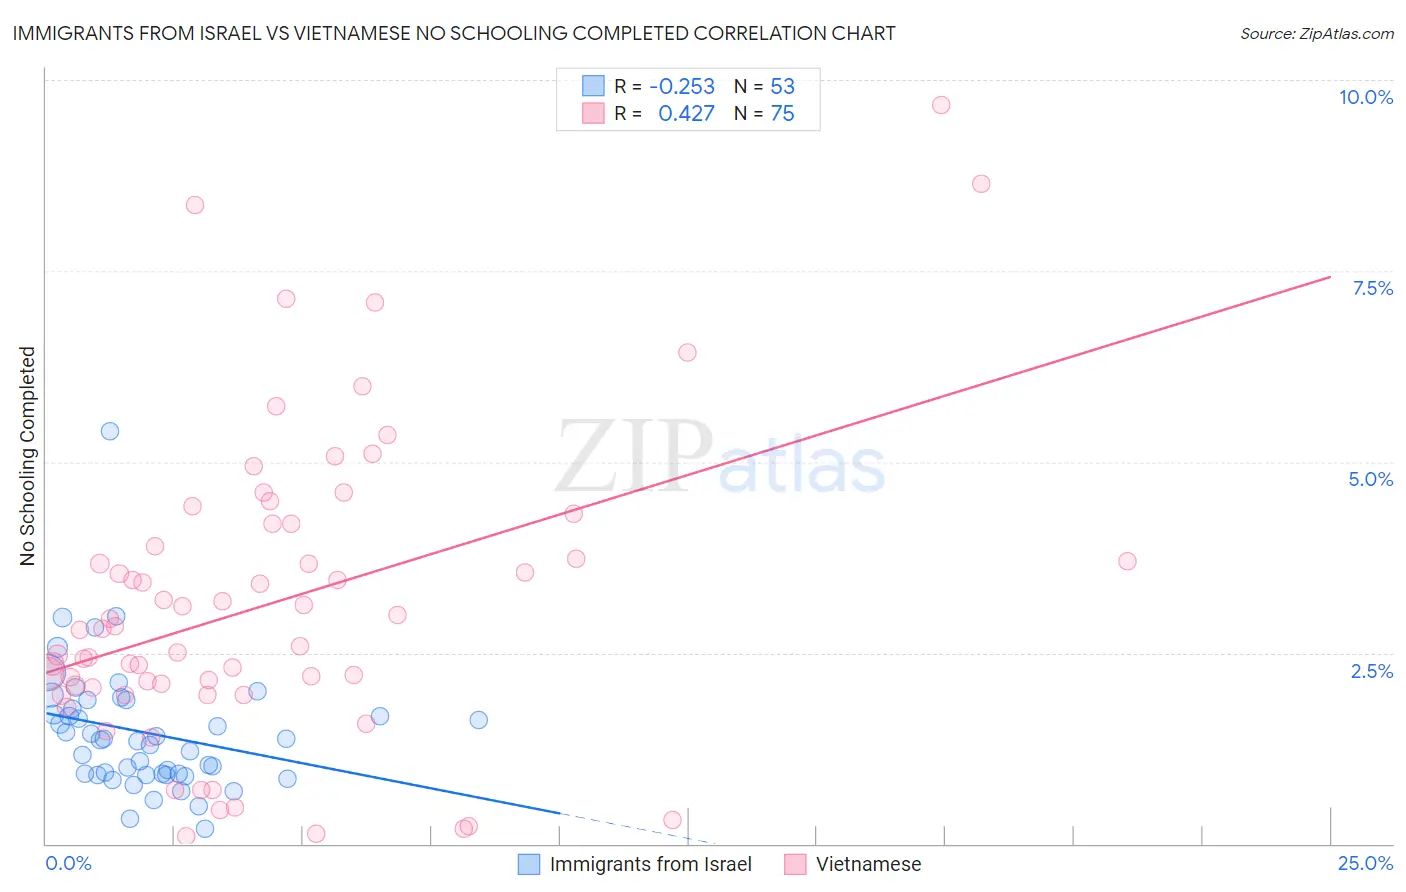
Immigrants from Israel vs Vietnamese No Schooling Completed Correlation Chart
The statistical analysis conducted on geographies consisting of 208,773,041 people shows a weak negative correlation between the proportion of Immigrants from Israel and percentage of population with no schooling in the United States with a correlation coefficient (R) of -0.253 and weighted average of 2.0%. Similarly, the statistical analysis conducted on geographies consisting of 170,340,562 people shows a moderate positive correlation between the proportion of Vietnamese and percentage of population with no schooling in the United States with a correlation coefficient (R) of 0.427 and weighted average of 3.2%, a difference of 61.5%.
No Schooling Completed Correlation Summary
| Measurement | Immigrants from Israel | Vietnamese |
| Minimum | 0.20% | 0.099% |
| Maximum | 5.4% | 9.7% |
| Range | 5.2% | 9.6% |
| Mean | 1.5% | 3.1% |
| Median | 1.4% | 2.8% |
| Interquartile 25% (IQ1) | 0.91% | 2.0% |
| Interquartile 75% (IQ3) | 1.8% | 4.2% |
| Interquartile Range (IQR) | 0.92% | 2.1% |
| Standard Deviation (Sample) | 0.84% | 2.0% |
| Standard Deviation (Population) | 0.83% | 2.0% |
Similar Demographics by No Schooling Completed
Demographics Similar to Immigrants from Israel by No Schooling Completed
In terms of no schooling completed, the demographic groups most similar to Immigrants from Israel are Filipino (2.0%, a difference of 0.030%), Jordanian (2.0%, a difference of 0.25%), Marshallese (2.0%, a difference of 0.51%), Immigrants from Greece (2.0%, a difference of 0.52%), and Burmese (1.9%, a difference of 0.89%).
| Demographics | Rating | Rank | No Schooling Completed |
| Immigrants | Hungary | 91.6 /100 | #131 | Exceptional 1.9% |
| Colville | 90.4 /100 | #132 | Exceptional 1.9% |
| Immigrants | Turkey | 90.2 /100 | #133 | Exceptional 1.9% |
| Menominee | 89.6 /100 | #134 | Excellent 1.9% |
| Hmong | 88.5 /100 | #135 | Excellent 1.9% |
| Burmese | 88.2 /100 | #136 | Excellent 1.9% |
| Filipinos | 85.5 /100 | #137 | Excellent 2.0% |
| Immigrants | Israel | 85.4 /100 | #138 | Excellent 2.0% |
| Jordanians | 84.5 /100 | #139 | Excellent 2.0% |
| Marshallese | 83.5 /100 | #140 | Excellent 2.0% |
| Immigrants | Greece | 83.5 /100 | #141 | Excellent 2.0% |
| Venezuelans | 81.5 /100 | #142 | Excellent 2.0% |
| Immigrants | South Central Asia | 80.0 /100 | #143 | Good 2.0% |
| Alsatians | 79.1 /100 | #144 | Good 2.0% |
| Immigrants | Iran | 79.0 /100 | #145 | Good 2.0% |
Demographics Similar to Vietnamese by No Schooling Completed
In terms of no schooling completed, the demographic groups most similar to Vietnamese are Immigrants from Honduras (3.2%, a difference of 0.19%), Mexican American Indian (3.2%, a difference of 0.34%), Immigrants from Laos (3.1%, a difference of 0.86%), Immigrants from Bangladesh (3.1%, a difference of 0.98%), and Immigrants from Burma/Myanmar (3.1%, a difference of 1.0%).
| Demographics | Rating | Rank | No Schooling Completed |
| Immigrants | Ecuador | 0.0 /100 | #316 | Tragic 3.1% |
| Cape Verdeans | 0.0 /100 | #317 | Tragic 3.1% |
| Immigrants | Guyana | 0.0 /100 | #318 | Tragic 3.1% |
| Immigrants | Burma/Myanmar | 0.0 /100 | #319 | Tragic 3.1% |
| Immigrants | Bangladesh | 0.0 /100 | #320 | Tragic 3.1% |
| Immigrants | Laos | 0.0 /100 | #321 | Tragic 3.1% |
| Immigrants | Honduras | 0.0 /100 | #322 | Tragic 3.2% |
| Vietnamese | 0.0 /100 | #323 | Tragic 3.2% |
| Mexican American Indians | 0.0 /100 | #324 | Tragic 3.2% |
| Dominicans | 0.0 /100 | #325 | Tragic 3.2% |
| Indonesians | 0.0 /100 | #326 | Tragic 3.2% |
| Immigrants | Latin America | 0.0 /100 | #327 | Tragic 3.3% |
| Mexicans | 0.0 /100 | #328 | Tragic 3.3% |
| Immigrants | Vietnam | 0.0 /100 | #329 | Tragic 3.3% |
| Immigrants | Armenia | 0.0 /100 | #330 | Tragic 3.3% |