Honduran vs Vietnamese No Schooling Completed
COMPARE
Honduran
Vietnamese
No Schooling Completed
No Schooling Completed Comparison
Hondurans
Vietnamese
3.1%
NO SCHOOLING COMPLETED
0.0/ 100
METRIC RATING
313th/ 347
METRIC RANK
3.2%
NO SCHOOLING COMPLETED
0.0/ 100
METRIC RATING
323rd/ 347
METRIC RANK
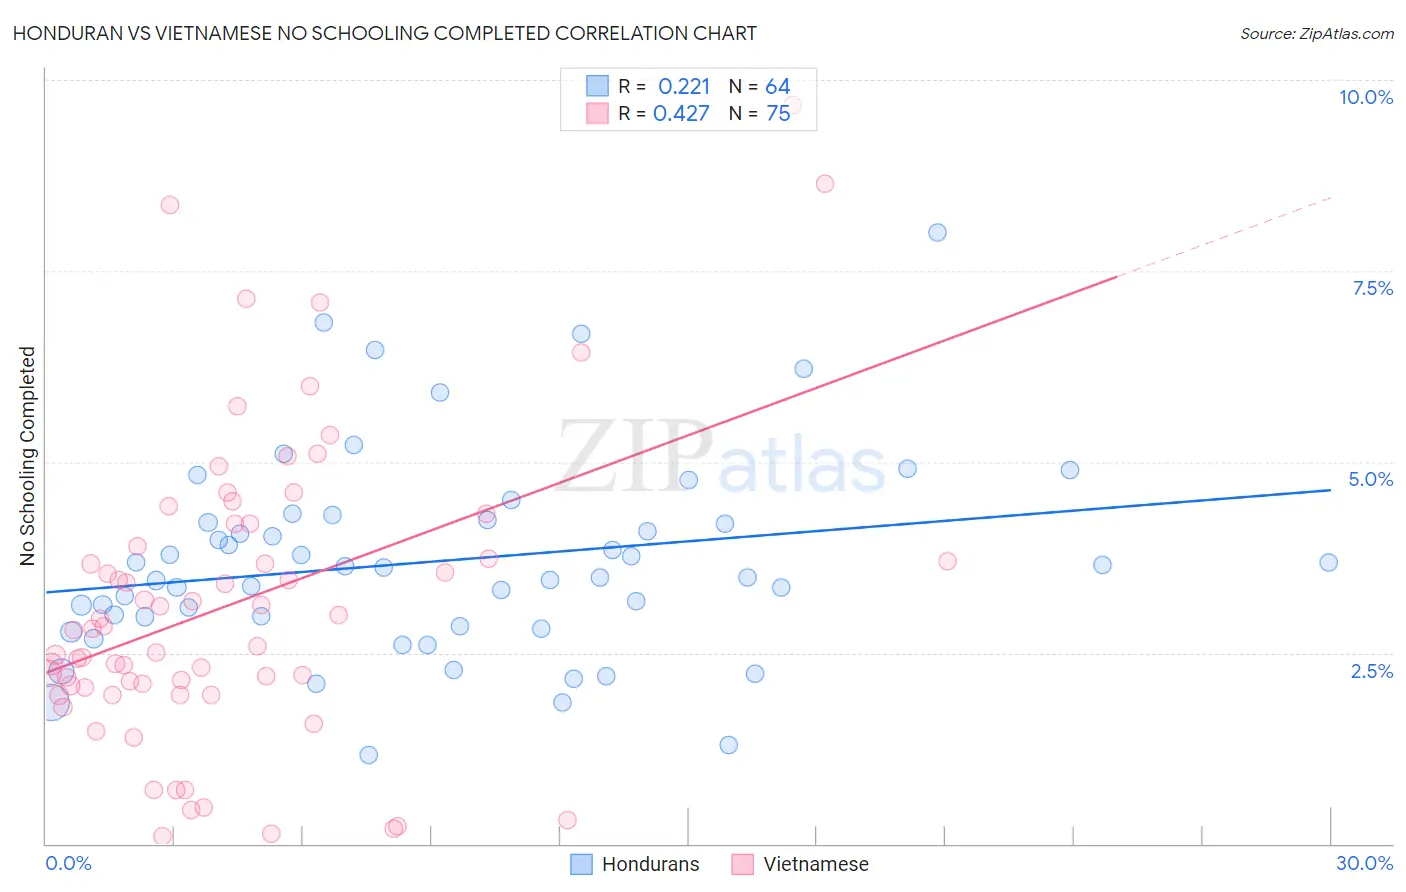
Honduran vs Vietnamese No Schooling Completed Correlation Chart
The statistical analysis conducted on geographies consisting of 355,822,203 people shows a weak positive correlation between the proportion of Hondurans and percentage of population with no schooling in the United States with a correlation coefficient (R) of 0.221 and weighted average of 3.1%. Similarly, the statistical analysis conducted on geographies consisting of 170,340,562 people shows a moderate positive correlation between the proportion of Vietnamese and percentage of population with no schooling in the United States with a correlation coefficient (R) of 0.427 and weighted average of 3.2%, a difference of 3.7%.
No Schooling Completed Correlation Summary
| Measurement | Honduran | Vietnamese |
| Minimum | 1.2% | 0.099% |
| Maximum | 8.0% | 9.7% |
| Range | 6.8% | 9.6% |
| Mean | 3.7% | 3.1% |
| Median | 3.6% | 2.8% |
| Interquartile 25% (IQ1) | 2.9% | 2.0% |
| Interquartile 75% (IQ3) | 4.2% | 4.2% |
| Interquartile Range (IQR) | 1.3% | 2.1% |
| Standard Deviation (Sample) | 1.3% | 2.0% |
| Standard Deviation (Population) | 1.3% | 2.0% |
Demographics Similar to Hondurans and Vietnamese by No Schooling Completed
In terms of no schooling completed, the demographic groups most similar to Hondurans are Immigrants from Belize (3.1%, a difference of 0.090%), Immigrants from Nicaragua (3.1%, a difference of 0.33%), Sri Lankan (3.0%, a difference of 0.51%), Immigrants from Ecuador (3.1%, a difference of 0.69%), and Immigrants from the Azores (3.0%, a difference of 0.79%). Similarly, the demographic groups most similar to Vietnamese are Immigrants from Honduras (3.2%, a difference of 0.19%), Mexican American Indian (3.2%, a difference of 0.34%), Immigrants from Laos (3.1%, a difference of 0.86%), Immigrants from Bangladesh (3.1%, a difference of 0.98%), and Immigrants from Burma/Myanmar (3.1%, a difference of 1.0%).
| Demographics | Rating | Rank | No Schooling Completed |
| Immigrants | Somalia | 0.0 /100 | #308 | Tragic 3.0% |
| Hispanics or Latinos | 0.0 /100 | #309 | Tragic 3.0% |
| Guyanese | 0.0 /100 | #310 | Tragic 3.0% |
| Immigrants | Azores | 0.0 /100 | #311 | Tragic 3.0% |
| Sri Lankans | 0.0 /100 | #312 | Tragic 3.0% |
| Hondurans | 0.0 /100 | #313 | Tragic 3.1% |
| Immigrants | Belize | 0.0 /100 | #314 | Tragic 3.1% |
| Immigrants | Nicaragua | 0.0 /100 | #315 | Tragic 3.1% |
| Immigrants | Ecuador | 0.0 /100 | #316 | Tragic 3.1% |
| Cape Verdeans | 0.0 /100 | #317 | Tragic 3.1% |
| Immigrants | Guyana | 0.0 /100 | #318 | Tragic 3.1% |
| Immigrants | Burma/Myanmar | 0.0 /100 | #319 | Tragic 3.1% |
| Immigrants | Bangladesh | 0.0 /100 | #320 | Tragic 3.1% |
| Immigrants | Laos | 0.0 /100 | #321 | Tragic 3.1% |
| Immigrants | Honduras | 0.0 /100 | #322 | Tragic 3.2% |
| Vietnamese | 0.0 /100 | #323 | Tragic 3.2% |
| Mexican American Indians | 0.0 /100 | #324 | Tragic 3.2% |
| Dominicans | 0.0 /100 | #325 | Tragic 3.2% |
| Indonesians | 0.0 /100 | #326 | Tragic 3.2% |
| Immigrants | Latin America | 0.0 /100 | #327 | Tragic 3.3% |
| Mexicans | 0.0 /100 | #328 | Tragic 3.3% |