Aleut vs Vietnamese No Schooling Completed
COMPARE
Aleut
Vietnamese
No Schooling Completed
No Schooling Completed Comparison
Aleuts
Vietnamese
1.6%
NO SCHOOLING COMPLETED
99.9/ 100
METRIC RATING
36th/ 347
METRIC RANK
3.2%
NO SCHOOLING COMPLETED
0.0/ 100
METRIC RATING
323rd/ 347
METRIC RANK
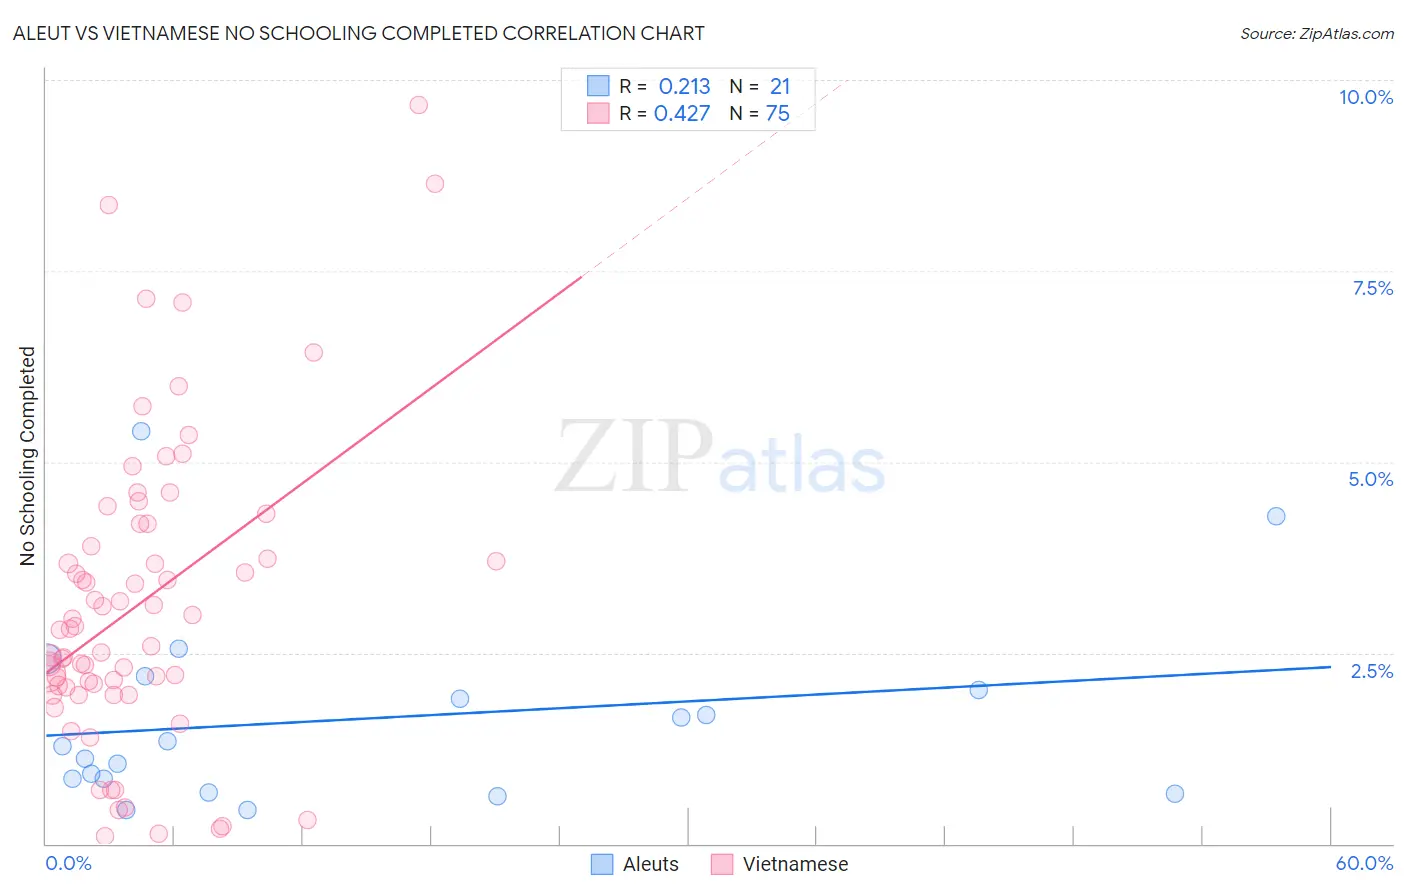
Aleut vs Vietnamese No Schooling Completed Correlation Chart
The statistical analysis conducted on geographies consisting of 61,492,558 people shows a weak positive correlation between the proportion of Aleuts and percentage of population with no schooling in the United States with a correlation coefficient (R) of 0.213 and weighted average of 1.6%. Similarly, the statistical analysis conducted on geographies consisting of 170,340,562 people shows a moderate positive correlation between the proportion of Vietnamese and percentage of population with no schooling in the United States with a correlation coefficient (R) of 0.427 and weighted average of 3.2%, a difference of 102.0%.
No Schooling Completed Correlation Summary
| Measurement | Aleut | Vietnamese |
| Minimum | 0.44% | 0.099% |
| Maximum | 5.4% | 9.7% |
| Range | 5.0% | 9.6% |
| Mean | 1.6% | 3.1% |
| Median | 1.3% | 2.8% |
| Interquartile 25% (IQ1) | 0.76% | 2.0% |
| Interquartile 75% (IQ3) | 2.1% | 4.2% |
| Interquartile Range (IQR) | 1.3% | 2.1% |
| Standard Deviation (Sample) | 1.3% | 2.0% |
| Standard Deviation (Population) | 1.2% | 2.0% |
Similar Demographics by No Schooling Completed
Demographics Similar to Aleuts by No Schooling Completed
In terms of no schooling completed, the demographic groups most similar to Aleuts are Belgian (1.6%, a difference of 0.27%), Northern European (1.6%, a difference of 0.40%), Native Hawaiian (1.6%, a difference of 0.67%), Eastern European (1.6%, a difference of 1.0%), and Luxembourger (1.6%, a difference of 1.0%).
| Demographics | Rating | Rank | No Schooling Completed |
| Lumbee | 100.0 /100 | #29 | Exceptional 1.5% |
| British | 100.0 /100 | #30 | Exceptional 1.5% |
| Inupiat | 100.0 /100 | #31 | Exceptional 1.5% |
| Swiss | 100.0 /100 | #32 | Exceptional 1.5% |
| Italians | 100.0 /100 | #33 | Exceptional 1.5% |
| Latvians | 100.0 /100 | #34 | Exceptional 1.5% |
| Eastern Europeans | 100.0 /100 | #35 | Exceptional 1.6% |
| Aleuts | 99.9 /100 | #36 | Exceptional 1.6% |
| Belgians | 99.9 /100 | #37 | Exceptional 1.6% |
| Northern Europeans | 99.9 /100 | #38 | Exceptional 1.6% |
| Native Hawaiians | 99.9 /100 | #39 | Exceptional 1.6% |
| Luxembourgers | 99.9 /100 | #40 | Exceptional 1.6% |
| Hungarians | 99.9 /100 | #41 | Exceptional 1.6% |
| Bulgarians | 99.9 /100 | #42 | Exceptional 1.6% |
| Australians | 99.9 /100 | #43 | Exceptional 1.6% |
Demographics Similar to Vietnamese by No Schooling Completed
In terms of no schooling completed, the demographic groups most similar to Vietnamese are Immigrants from Honduras (3.2%, a difference of 0.19%), Mexican American Indian (3.2%, a difference of 0.34%), Immigrants from Laos (3.1%, a difference of 0.86%), Immigrants from Bangladesh (3.1%, a difference of 0.98%), and Immigrants from Burma/Myanmar (3.1%, a difference of 1.0%).
| Demographics | Rating | Rank | No Schooling Completed |
| Immigrants | Ecuador | 0.0 /100 | #316 | Tragic 3.1% |
| Cape Verdeans | 0.0 /100 | #317 | Tragic 3.1% |
| Immigrants | Guyana | 0.0 /100 | #318 | Tragic 3.1% |
| Immigrants | Burma/Myanmar | 0.0 /100 | #319 | Tragic 3.1% |
| Immigrants | Bangladesh | 0.0 /100 | #320 | Tragic 3.1% |
| Immigrants | Laos | 0.0 /100 | #321 | Tragic 3.1% |
| Immigrants | Honduras | 0.0 /100 | #322 | Tragic 3.2% |
| Vietnamese | 0.0 /100 | #323 | Tragic 3.2% |
| Mexican American Indians | 0.0 /100 | #324 | Tragic 3.2% |
| Dominicans | 0.0 /100 | #325 | Tragic 3.2% |
| Indonesians | 0.0 /100 | #326 | Tragic 3.2% |
| Immigrants | Latin America | 0.0 /100 | #327 | Tragic 3.3% |
| Mexicans | 0.0 /100 | #328 | Tragic 3.3% |
| Immigrants | Vietnam | 0.0 /100 | #329 | Tragic 3.3% |
| Immigrants | Armenia | 0.0 /100 | #330 | Tragic 3.3% |