Paraguayan vs Vietnamese Family Households
COMPARE
Paraguayan
Vietnamese
Family Households
Family Households Comparison
Paraguayans
Vietnamese
64.1%
FAMILY HOUSEHOLDS
26.7/ 100
METRIC RATING
188th/ 347
METRIC RANK
64.2%
FAMILY HOUSEHOLDS
43.6/ 100
METRIC RATING
176th/ 347
METRIC RANK
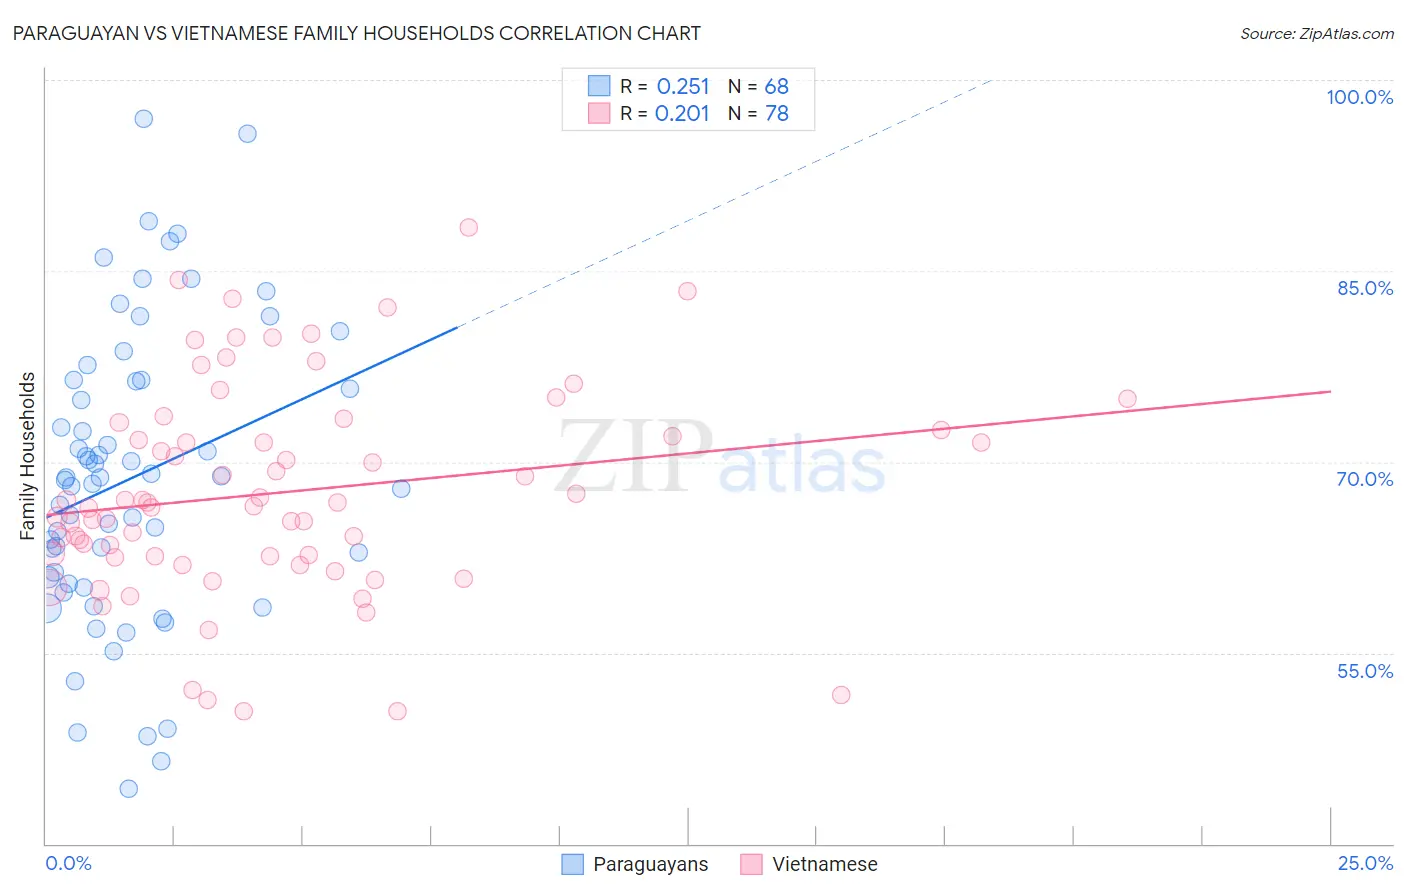
Paraguayan vs Vietnamese Family Households Correlation Chart
The statistical analysis conducted on geographies consisting of 95,096,913 people shows a weak positive correlation between the proportion of Paraguayans and percentage of family households in the United States with a correlation coefficient (R) of 0.251 and weighted average of 64.1%. Similarly, the statistical analysis conducted on geographies consisting of 170,660,607 people shows a weak positive correlation between the proportion of Vietnamese and percentage of family households in the United States with a correlation coefficient (R) of 0.201 and weighted average of 64.2%, a difference of 0.25%.
Family Households Correlation Summary
| Measurement | Paraguayan | Vietnamese |
| Minimum | 44.3% | 50.4% |
| Maximum | 96.9% | 88.4% |
| Range | 52.6% | 38.0% |
| Mean | 68.8% | 67.6% |
| Median | 68.7% | 66.7% |
| Interquartile 25% (IQ1) | 60.7% | 62.6% |
| Interquartile 75% (IQ3) | 76.4% | 72.5% |
| Interquartile Range (IQR) | 15.7% | 9.9% |
| Standard Deviation (Sample) | 11.5% | 8.2% |
| Standard Deviation (Population) | 11.5% | 8.2% |
Demographics Similar to Paraguayans and Vietnamese by Family Households
In terms of family households, the demographic groups most similar to Paraguayans are Immigrants from Western Asia (64.1%, a difference of 0.020%), Northern European (64.1%, a difference of 0.030%), Zimbabwean (64.1%, a difference of 0.040%), Arab (64.1%, a difference of 0.040%), and Lithuanian (64.0%, a difference of 0.050%). Similarly, the demographic groups most similar to Vietnamese are Bangladeshi (64.3%, a difference of 0.010%), Immigrants from Micronesia (64.2%, a difference of 0.020%), Jamaican (64.2%, a difference of 0.040%), Immigrants from Ukraine (64.2%, a difference of 0.080%), and Immigrants from Germany (64.3%, a difference of 0.090%).
| Demographics | Rating | Rank | Family Households |
| Dutch West Indians | 53.9 /100 | #172 | Average 64.3% |
| Immigrants | Sierra Leone | 52.5 /100 | #173 | Average 64.3% |
| Immigrants | Germany | 50.0 /100 | #174 | Average 64.3% |
| Bangladeshis | 44.3 /100 | #175 | Average 64.3% |
| Vietnamese | 43.6 /100 | #176 | Average 64.2% |
| Immigrants | Micronesia | 42.3 /100 | #177 | Average 64.2% |
| Jamaicans | 40.6 /100 | #178 | Average 64.2% |
| Immigrants | Ukraine | 38.2 /100 | #179 | Fair 64.2% |
| Immigrants | Honduras | 35.0 /100 | #180 | Fair 64.2% |
| Immigrants | Trinidad and Tobago | 34.9 /100 | #181 | Fair 64.2% |
| Ukrainians | 34.6 /100 | #182 | Fair 64.2% |
| Creek | 34.1 /100 | #183 | Fair 64.2% |
| Puerto Ricans | 33.4 /100 | #184 | Fair 64.2% |
| Immigrants | Iran | 30.4 /100 | #185 | Fair 64.1% |
| Spanish Americans | 30.1 /100 | #186 | Fair 64.1% |
| Northern Europeans | 28.2 /100 | #187 | Fair 64.1% |
| Paraguayans | 26.7 /100 | #188 | Fair 64.1% |
| Immigrants | Western Asia | 25.3 /100 | #189 | Fair 64.1% |
| Zimbabweans | 24.7 /100 | #190 | Fair 64.1% |
| Arabs | 24.5 /100 | #191 | Fair 64.1% |
| Lithuanians | 23.8 /100 | #192 | Fair 64.0% |