Immigrants from Argentina vs Vietnamese No Schooling Completed
COMPARE
Immigrants from Argentina
Vietnamese
No Schooling Completed
No Schooling Completed Comparison
Immigrants from Argentina
Vietnamese
2.1%
NO SCHOOLING COMPLETED
52.7/ 100
METRIC RATING
172nd/ 347
METRIC RANK
3.2%
NO SCHOOLING COMPLETED
0.0/ 100
METRIC RATING
323rd/ 347
METRIC RANK
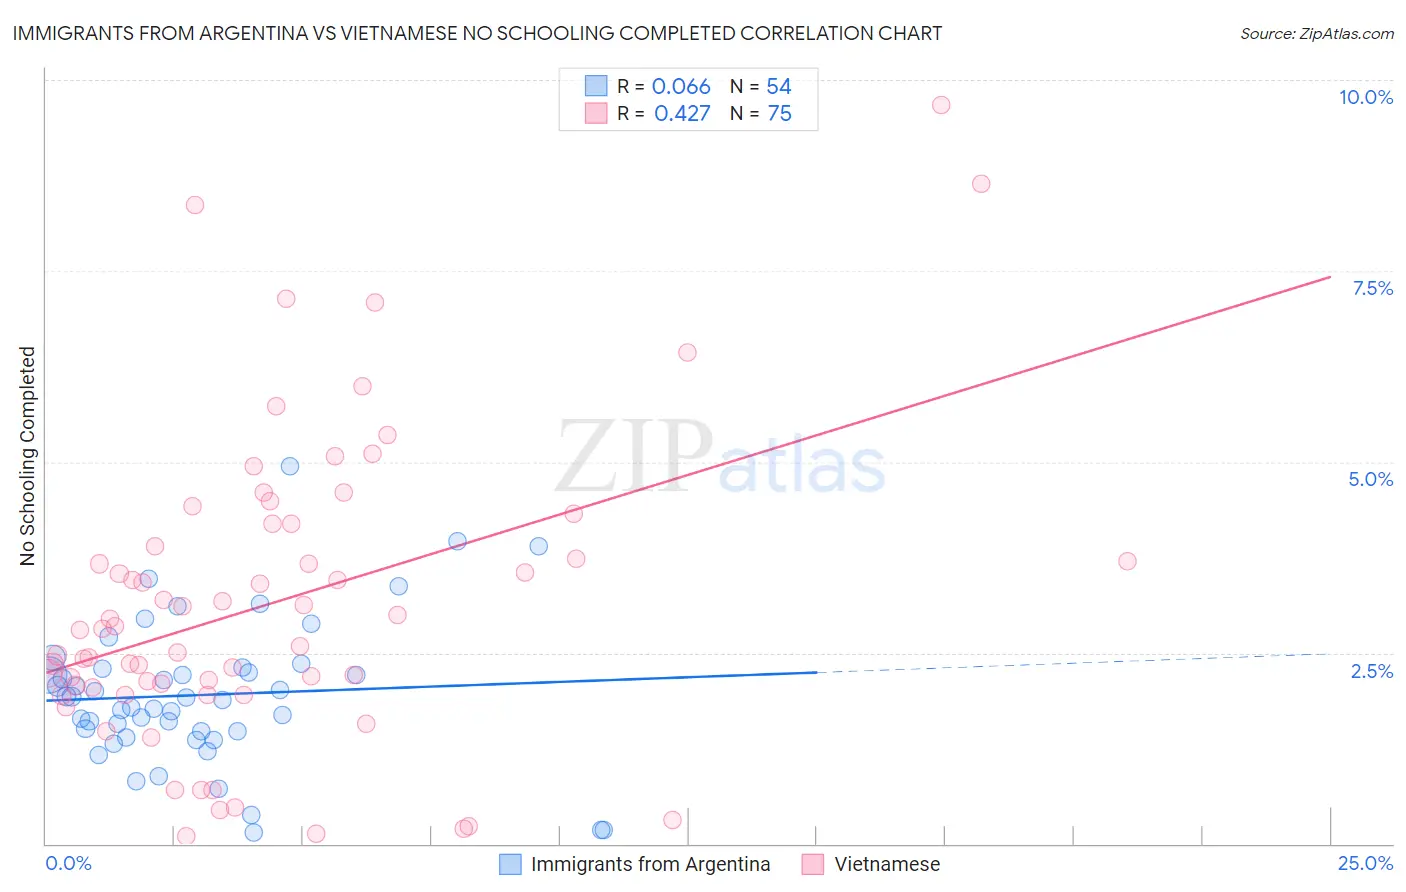
Immigrants from Argentina vs Vietnamese No Schooling Completed Correlation Chart
The statistical analysis conducted on geographies consisting of 262,849,156 people shows a slight positive correlation between the proportion of Immigrants from Argentina and percentage of population with no schooling in the United States with a correlation coefficient (R) of 0.066 and weighted average of 2.1%. Similarly, the statistical analysis conducted on geographies consisting of 170,340,562 people shows a moderate positive correlation between the proportion of Vietnamese and percentage of population with no schooling in the United States with a correlation coefficient (R) of 0.427 and weighted average of 3.2%, a difference of 52.4%.
No Schooling Completed Correlation Summary
| Measurement | Immigrants from Argentina | Vietnamese |
| Minimum | 0.14% | 0.099% |
| Maximum | 4.9% | 9.7% |
| Range | 4.8% | 9.6% |
| Mean | 1.9% | 3.1% |
| Median | 1.9% | 2.8% |
| Interquartile 25% (IQ1) | 1.5% | 2.0% |
| Interquartile 75% (IQ3) | 2.3% | 4.2% |
| Interquartile Range (IQR) | 0.82% | 2.1% |
| Standard Deviation (Sample) | 0.94% | 2.0% |
| Standard Deviation (Population) | 0.94% | 2.0% |
Similar Demographics by No Schooling Completed
Demographics Similar to Immigrants from Argentina by No Schooling Completed
In terms of no schooling completed, the demographic groups most similar to Immigrants from Argentina are Immigrants from Belarus (2.1%, a difference of 0.13%), Immigrants from Poland (2.1%, a difference of 0.33%), Immigrants from Micronesia (2.1%, a difference of 0.37%), Argentinean (2.1%, a difference of 0.45%), and Apache (2.1%, a difference of 0.53%).
| Demographics | Rating | Rank | No Schooling Completed |
| Brazilians | 60.2 /100 | #165 | Good 2.1% |
| Dutch West Indians | 59.9 /100 | #166 | Average 2.1% |
| Egyptians | 59.2 /100 | #167 | Average 2.1% |
| Cheyenne | 58.6 /100 | #168 | Average 2.1% |
| Apache | 56.7 /100 | #169 | Average 2.1% |
| Argentineans | 56.0 /100 | #170 | Average 2.1% |
| Immigrants | Poland | 55.2 /100 | #171 | Average 2.1% |
| Immigrants | Argentina | 52.7 /100 | #172 | Average 2.1% |
| Immigrants | Belarus | 51.8 /100 | #173 | Average 2.1% |
| Immigrants | Micronesia | 50.0 /100 | #174 | Average 2.1% |
| Arabs | 46.4 /100 | #175 | Average 2.1% |
| Panamanians | 45.2 /100 | #176 | Average 2.1% |
| Arapaho | 45.0 /100 | #177 | Average 2.1% |
| Pakistanis | 44.7 /100 | #178 | Average 2.1% |
| Immigrants | Kazakhstan | 44.3 /100 | #179 | Average 2.1% |
Demographics Similar to Vietnamese by No Schooling Completed
In terms of no schooling completed, the demographic groups most similar to Vietnamese are Immigrants from Honduras (3.2%, a difference of 0.19%), Mexican American Indian (3.2%, a difference of 0.34%), Immigrants from Laos (3.1%, a difference of 0.86%), Immigrants from Bangladesh (3.1%, a difference of 0.98%), and Immigrants from Burma/Myanmar (3.1%, a difference of 1.0%).
| Demographics | Rating | Rank | No Schooling Completed |
| Immigrants | Ecuador | 0.0 /100 | #316 | Tragic 3.1% |
| Cape Verdeans | 0.0 /100 | #317 | Tragic 3.1% |
| Immigrants | Guyana | 0.0 /100 | #318 | Tragic 3.1% |
| Immigrants | Burma/Myanmar | 0.0 /100 | #319 | Tragic 3.1% |
| Immigrants | Bangladesh | 0.0 /100 | #320 | Tragic 3.1% |
| Immigrants | Laos | 0.0 /100 | #321 | Tragic 3.1% |
| Immigrants | Honduras | 0.0 /100 | #322 | Tragic 3.2% |
| Vietnamese | 0.0 /100 | #323 | Tragic 3.2% |
| Mexican American Indians | 0.0 /100 | #324 | Tragic 3.2% |
| Dominicans | 0.0 /100 | #325 | Tragic 3.2% |
| Indonesians | 0.0 /100 | #326 | Tragic 3.2% |
| Immigrants | Latin America | 0.0 /100 | #327 | Tragic 3.3% |
| Mexicans | 0.0 /100 | #328 | Tragic 3.3% |
| Immigrants | Vietnam | 0.0 /100 | #329 | Tragic 3.3% |
| Immigrants | Armenia | 0.0 /100 | #330 | Tragic 3.3% |