German vs Vietnamese No Schooling Completed
COMPARE
German
Vietnamese
No Schooling Completed
No Schooling Completed Comparison
Germans
Vietnamese
1.4%
NO SCHOOLING COMPLETED
100.0/ 100
METRIC RATING
4th/ 347
METRIC RANK
3.2%
NO SCHOOLING COMPLETED
0.0/ 100
METRIC RATING
323rd/ 347
METRIC RANK
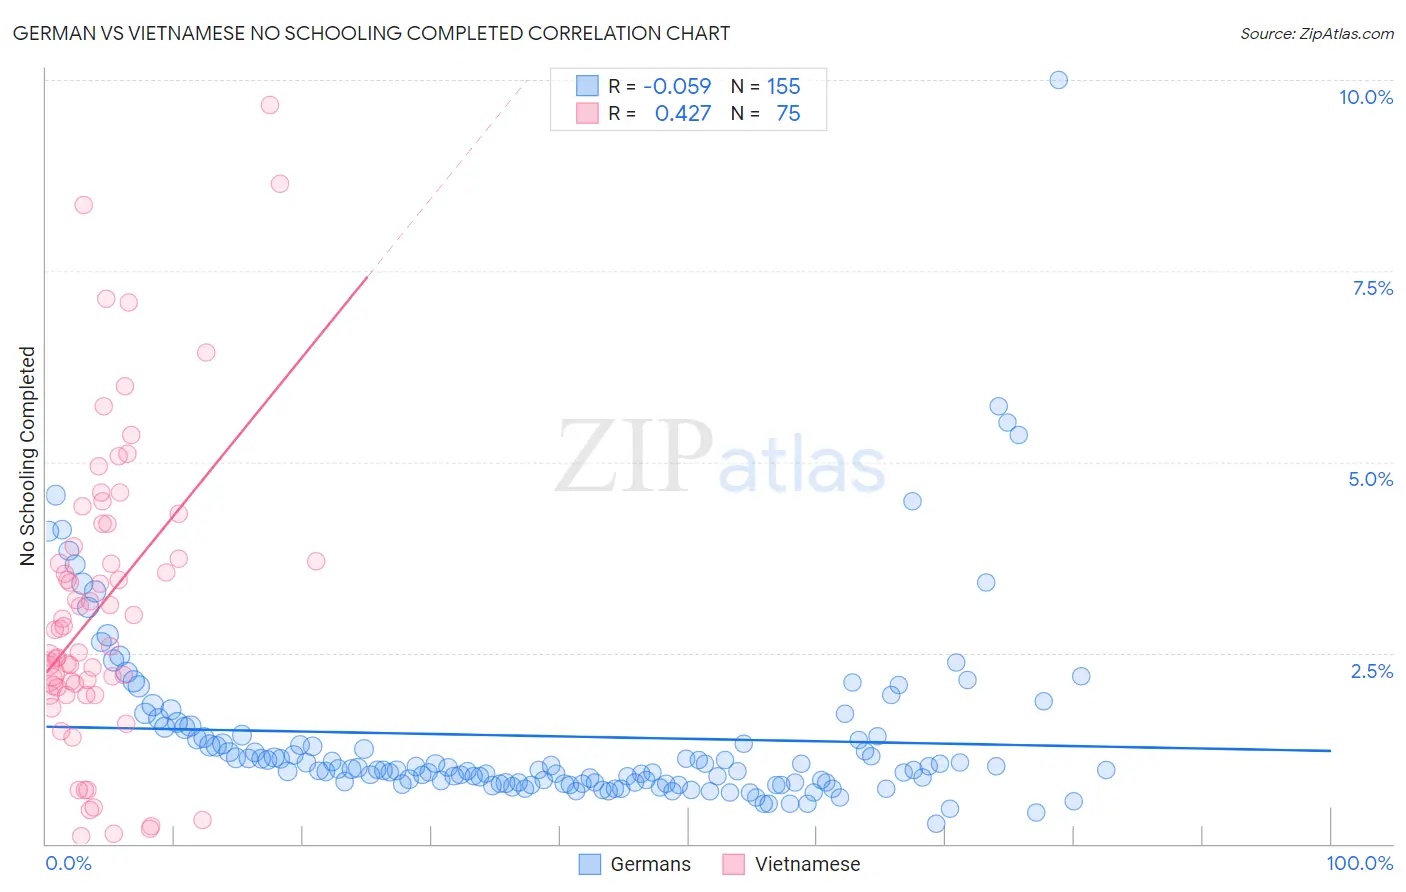
German vs Vietnamese No Schooling Completed Correlation Chart
The statistical analysis conducted on geographies consisting of 559,407,426 people shows a slight negative correlation between the proportion of Germans and percentage of population with no schooling in the United States with a correlation coefficient (R) of -0.059 and weighted average of 1.4%. Similarly, the statistical analysis conducted on geographies consisting of 170,340,562 people shows a moderate positive correlation between the proportion of Vietnamese and percentage of population with no schooling in the United States with a correlation coefficient (R) of 0.427 and weighted average of 3.2%, a difference of 134.3%.
No Schooling Completed Correlation Summary
| Measurement | German | Vietnamese |
| Minimum | 0.26% | 0.099% |
| Maximum | 10.0% | 9.7% |
| Range | 9.7% | 9.6% |
| Mean | 1.4% | 3.1% |
| Median | 0.98% | 2.8% |
| Interquartile 25% (IQ1) | 0.80% | 2.0% |
| Interquartile 75% (IQ3) | 1.4% | 4.2% |
| Interquartile Range (IQR) | 0.61% | 2.1% |
| Standard Deviation (Sample) | 1.2% | 2.0% |
| Standard Deviation (Population) | 1.2% | 2.0% |
Similar Demographics by No Schooling Completed
Demographics Similar to Germans by No Schooling Completed
In terms of no schooling completed, the demographic groups most similar to Germans are Slovene (1.4%, a difference of 0.42%), Norwegian (1.3%, a difference of 0.56%), Slovak (1.3%, a difference of 0.99%), Carpatho Rusyn (1.4%, a difference of 1.2%), and English (1.4%, a difference of 2.2%).
| Demographics | Rating | Rank | No Schooling Completed |
| Yup'ik | 100.0 /100 | #1 | Exceptional 1.2% |
| Slovaks | 100.0 /100 | #2 | Exceptional 1.3% |
| Norwegians | 100.0 /100 | #3 | Exceptional 1.3% |
| Germans | 100.0 /100 | #4 | Exceptional 1.4% |
| Slovenes | 100.0 /100 | #5 | Exceptional 1.4% |
| Carpatho Rusyns | 100.0 /100 | #6 | Exceptional 1.4% |
| English | 100.0 /100 | #7 | Exceptional 1.4% |
| Swedes | 100.0 /100 | #8 | Exceptional 1.4% |
| Scottish | 100.0 /100 | #9 | Exceptional 1.4% |
| Dutch | 100.0 /100 | #10 | Exceptional 1.4% |
| Lithuanians | 100.0 /100 | #11 | Exceptional 1.4% |
| Irish | 100.0 /100 | #12 | Exceptional 1.4% |
| Poles | 100.0 /100 | #13 | Exceptional 1.4% |
| Scotch-Irish | 100.0 /100 | #14 | Exceptional 1.5% |
| Tlingit-Haida | 100.0 /100 | #15 | Exceptional 1.5% |
Demographics Similar to Vietnamese by No Schooling Completed
In terms of no schooling completed, the demographic groups most similar to Vietnamese are Immigrants from Honduras (3.2%, a difference of 0.19%), Mexican American Indian (3.2%, a difference of 0.34%), Immigrants from Laos (3.1%, a difference of 0.86%), Immigrants from Bangladesh (3.1%, a difference of 0.98%), and Immigrants from Burma/Myanmar (3.1%, a difference of 1.0%).
| Demographics | Rating | Rank | No Schooling Completed |
| Immigrants | Ecuador | 0.0 /100 | #316 | Tragic 3.1% |
| Cape Verdeans | 0.0 /100 | #317 | Tragic 3.1% |
| Immigrants | Guyana | 0.0 /100 | #318 | Tragic 3.1% |
| Immigrants | Burma/Myanmar | 0.0 /100 | #319 | Tragic 3.1% |
| Immigrants | Bangladesh | 0.0 /100 | #320 | Tragic 3.1% |
| Immigrants | Laos | 0.0 /100 | #321 | Tragic 3.1% |
| Immigrants | Honduras | 0.0 /100 | #322 | Tragic 3.2% |
| Vietnamese | 0.0 /100 | #323 | Tragic 3.2% |
| Mexican American Indians | 0.0 /100 | #324 | Tragic 3.2% |
| Dominicans | 0.0 /100 | #325 | Tragic 3.2% |
| Indonesians | 0.0 /100 | #326 | Tragic 3.2% |
| Immigrants | Latin America | 0.0 /100 | #327 | Tragic 3.3% |
| Mexicans | 0.0 /100 | #328 | Tragic 3.3% |
| Immigrants | Vietnam | 0.0 /100 | #329 | Tragic 3.3% |
| Immigrants | Armenia | 0.0 /100 | #330 | Tragic 3.3% |