Paraguayan vs Nonimmigrants 12th Grade, No Diploma
COMPARE
Paraguayan
Nonimmigrants
12th Grade, No Diploma
12th Grade, No Diploma Comparison
Paraguayans
Nonimmigrants
91.5%
12TH GRADE, NO DIPLOMA
78.9/ 100
METRIC RATING
150th/ 347
METRIC RANK
91.0%
12TH GRADE, NO DIPLOMA
38.8/ 100
METRIC RATING
182nd/ 347
METRIC RANK
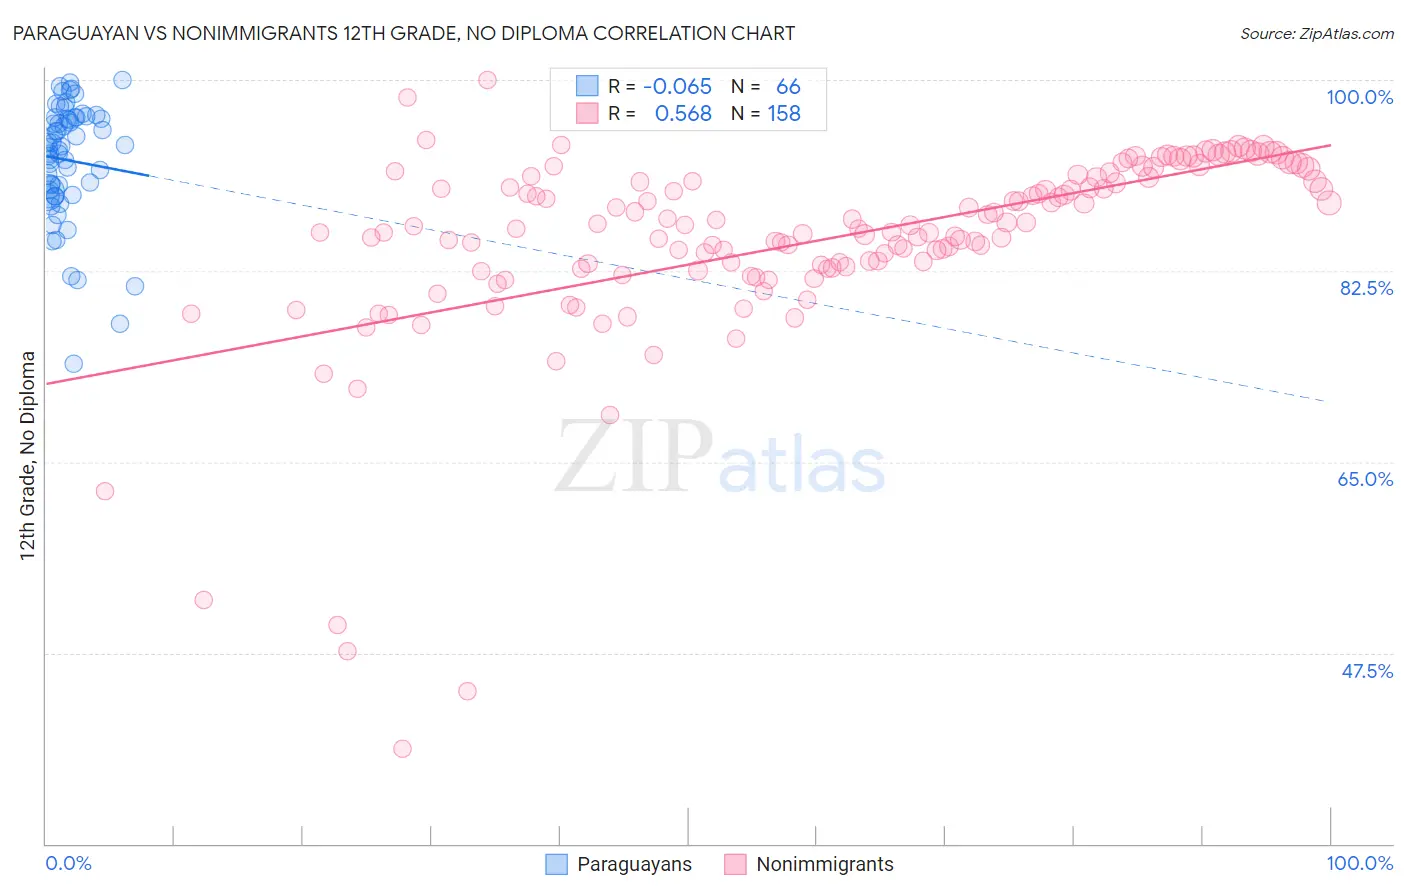
Paraguayan vs Nonimmigrants 12th Grade, No Diploma Correlation Chart
The statistical analysis conducted on geographies consisting of 95,114,201 people shows a slight negative correlation between the proportion of Paraguayans and percentage of population with at least 12th grade (no diploma) education in the United States with a correlation coefficient (R) of -0.065 and weighted average of 91.5%. Similarly, the statistical analysis conducted on geographies consisting of 585,370,179 people shows a substantial positive correlation between the proportion of Nonimmigrants and percentage of population with at least 12th grade (no diploma) education in the United States with a correlation coefficient (R) of 0.568 and weighted average of 91.0%, a difference of 0.55%.
12th Grade, No Diploma Correlation Summary
| Measurement | Paraguayan | Nonimmigrants |
| Minimum | 73.9% | 38.7% |
| Maximum | 100.0% | 100.0% |
| Range | 26.1% | 61.3% |
| Mean | 92.7% | 85.3% |
| Median | 93.8% | 86.5% |
| Interquartile 25% (IQ1) | 89.7% | 82.8% |
| Interquartile 75% (IQ3) | 96.6% | 91.1% |
| Interquartile Range (IQR) | 6.9% | 8.3% |
| Standard Deviation (Sample) | 5.4% | 9.1% |
| Standard Deviation (Population) | 5.4% | 9.1% |
Similar Demographics by 12th Grade, No Diploma
Demographics Similar to Paraguayans by 12th Grade, No Diploma
In terms of 12th grade, no diploma, the demographic groups most similar to Paraguayans are Ugandan (91.5%, a difference of 0.0%), Chippewa (91.5%, a difference of 0.0%), Pakistani (91.5%, a difference of 0.010%), Indian (Asian) (91.5%, a difference of 0.010%), and Immigrants from Spain (91.6%, a difference of 0.020%).
| Demographics | Rating | Rank | 12th Grade, No Diploma |
| Immigrants | Argentina | 80.7 /100 | #143 | Excellent 91.6% |
| Immigrants | Spain | 80.1 /100 | #144 | Excellent 91.6% |
| Immigrants | Lebanon | 80.0 /100 | #145 | Excellent 91.6% |
| Immigrants | Brazil | 79.8 /100 | #146 | Good 91.5% |
| Pakistanis | 79.6 /100 | #147 | Good 91.5% |
| Indians (Asian) | 79.4 /100 | #148 | Good 91.5% |
| Ugandans | 79.0 /100 | #149 | Good 91.5% |
| Paraguayans | 78.9 /100 | #150 | Good 91.5% |
| Chippewa | 78.8 /100 | #151 | Good 91.5% |
| Kenyans | 77.4 /100 | #152 | Good 91.5% |
| Iraqis | 75.3 /100 | #153 | Good 91.5% |
| Immigrants | Kenya | 73.9 /100 | #154 | Good 91.5% |
| Immigrants | Iraq | 73.0 /100 | #155 | Good 91.4% |
| Asians | 71.9 /100 | #156 | Good 91.4% |
| Immigrants | Pakistan | 70.7 /100 | #157 | Good 91.4% |
Demographics Similar to Nonimmigrants by 12th Grade, No Diploma
In terms of 12th grade, no diploma, the demographic groups most similar to Nonimmigrants are Guamanian/Chamorro (91.0%, a difference of 0.010%), Osage (91.0%, a difference of 0.010%), Immigrants from Syria (91.1%, a difference of 0.020%), Spaniard (91.0%, a difference of 0.030%), and Spanish (91.1%, a difference of 0.060%).
| Demographics | Rating | Rank | 12th Grade, No Diploma |
| Immigrants | Western Asia | 49.0 /100 | #175 | Average 91.2% |
| Iroquois | 48.5 /100 | #176 | Average 91.1% |
| Sierra Leoneans | 47.7 /100 | #177 | Average 91.1% |
| Spanish | 43.7 /100 | #178 | Average 91.1% |
| Immigrants | Chile | 43.3 /100 | #179 | Average 91.1% |
| Immigrants | Syria | 40.3 /100 | #180 | Average 91.1% |
| Guamanians/Chamorros | 39.5 /100 | #181 | Fair 91.0% |
| Immigrants | Nonimmigrants | 38.8 /100 | #182 | Fair 91.0% |
| Osage | 38.3 /100 | #183 | Fair 91.0% |
| Spaniards | 36.2 /100 | #184 | Fair 91.0% |
| Sudanese | 34.4 /100 | #185 | Fair 91.0% |
| Ethiopians | 33.9 /100 | #186 | Fair 91.0% |
| Potawatomi | 32.9 /100 | #187 | Fair 91.0% |
| Americans | 32.6 /100 | #188 | Fair 91.0% |
| Immigrants | Uganda | 31.6 /100 | #189 | Fair 90.9% |