Paraguayan vs Immigrants from Honduras Associate's Degree
COMPARE
Paraguayan
Immigrants from Honduras
Associate's Degree
Associate's Degree Comparison
Paraguayans
Immigrants from Honduras
51.8%
ASSOCIATE'S DEGREE
99.8/ 100
METRIC RATING
57th/ 347
METRIC RANK
38.5%
ASSOCIATE'S DEGREE
0.0/ 100
METRIC RATING
305th/ 347
METRIC RANK
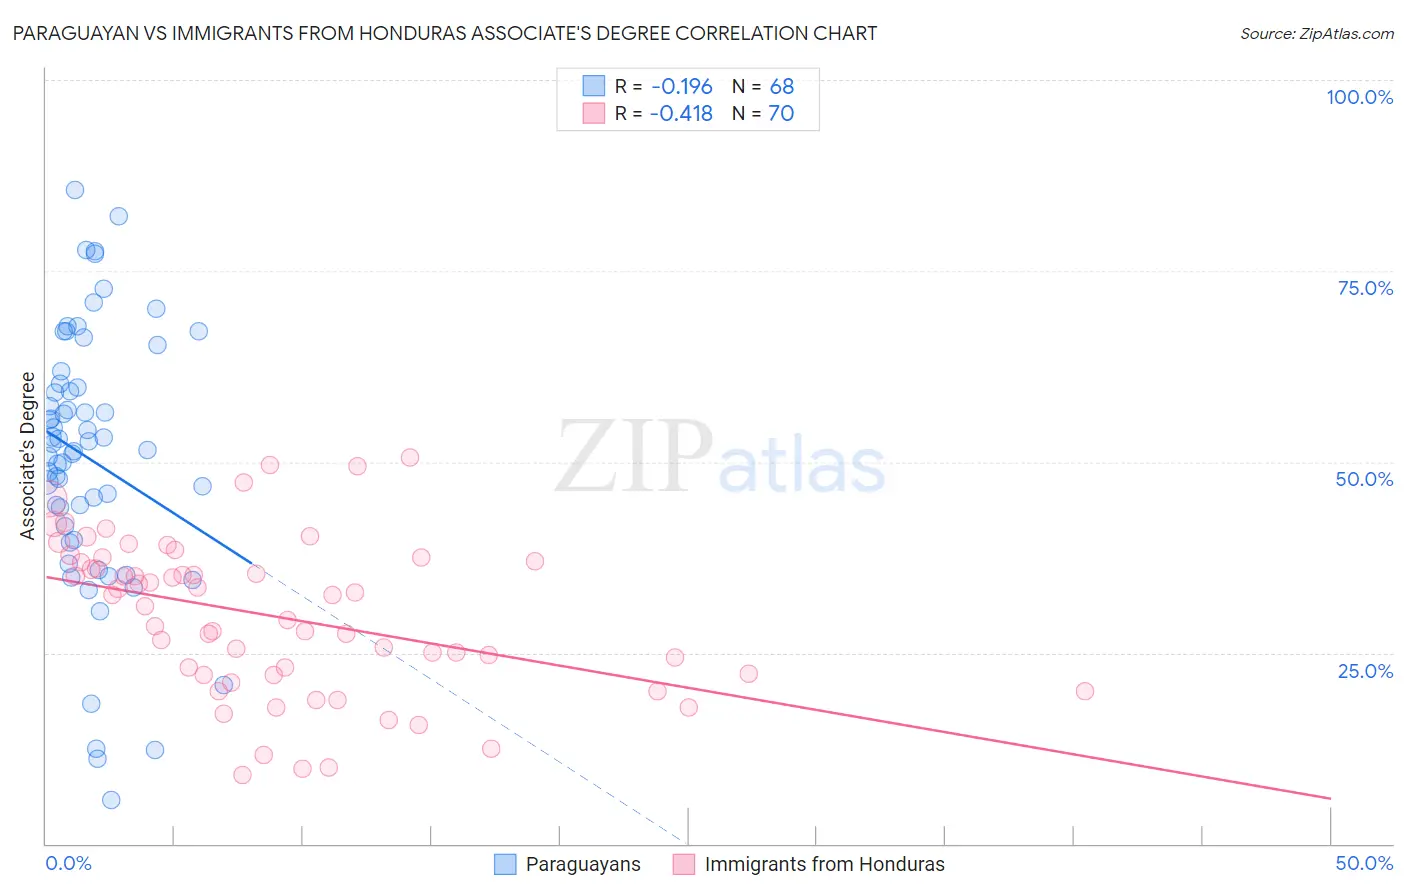
Paraguayan vs Immigrants from Honduras Associate's Degree Correlation Chart
The statistical analysis conducted on geographies consisting of 95,113,072 people shows a poor negative correlation between the proportion of Paraguayans and percentage of population with at least associate's degree education in the United States with a correlation coefficient (R) of -0.196 and weighted average of 51.8%. Similarly, the statistical analysis conducted on geographies consisting of 322,624,336 people shows a moderate negative correlation between the proportion of Immigrants from Honduras and percentage of population with at least associate's degree education in the United States with a correlation coefficient (R) of -0.418 and weighted average of 38.5%, a difference of 34.8%.
Associate's Degree Correlation Summary
| Measurement | Paraguayan | Immigrants from Honduras |
| Minimum | 5.7% | 9.0% |
| Maximum | 85.7% | 50.5% |
| Range | 79.9% | 41.5% |
| Mean | 50.4% | 29.8% |
| Median | 52.0% | 31.8% |
| Interquartile 25% (IQ1) | 40.7% | 22.0% |
| Interquartile 75% (IQ3) | 60.0% | 37.1% |
| Interquartile Range (IQR) | 19.3% | 15.0% |
| Standard Deviation (Sample) | 17.1% | 10.2% |
| Standard Deviation (Population) | 17.0% | 10.1% |
Similar Demographics by Associate's Degree
Demographics Similar to Paraguayans by Associate's Degree
In terms of associate's degree, the demographic groups most similar to Paraguayans are New Zealander (51.8%, a difference of 0.030%), Immigrants from Czechoslovakia (51.9%, a difference of 0.12%), Australian (51.9%, a difference of 0.14%), Immigrants from Serbia (51.7%, a difference of 0.16%), and Immigrants from Spain (51.9%, a difference of 0.17%).
| Demographics | Rating | Rank | Associate's Degree |
| Asians | 99.9 /100 | #50 | Exceptional 52.1% |
| Immigrants | Greece | 99.9 /100 | #51 | Exceptional 52.1% |
| Bolivians | 99.8 /100 | #52 | Exceptional 52.0% |
| Immigrants | Asia | 99.8 /100 | #53 | Exceptional 52.0% |
| Immigrants | Spain | 99.8 /100 | #54 | Exceptional 51.9% |
| Australians | 99.8 /100 | #55 | Exceptional 51.9% |
| Immigrants | Czechoslovakia | 99.8 /100 | #56 | Exceptional 51.9% |
| Paraguayans | 99.8 /100 | #57 | Exceptional 51.8% |
| New Zealanders | 99.8 /100 | #58 | Exceptional 51.8% |
| Immigrants | Serbia | 99.8 /100 | #59 | Exceptional 51.7% |
| Immigrants | Bolivia | 99.7 /100 | #60 | Exceptional 51.5% |
| Immigrants | Kazakhstan | 99.7 /100 | #61 | Exceptional 51.4% |
| Bhutanese | 99.7 /100 | #62 | Exceptional 51.4% |
| South Africans | 99.7 /100 | #63 | Exceptional 51.4% |
| Immigrants | Netherlands | 99.7 /100 | #64 | Exceptional 51.4% |
Demographics Similar to Immigrants from Honduras by Associate's Degree
In terms of associate's degree, the demographic groups most similar to Immigrants from Honduras are Sioux (38.5%, a difference of 0.070%), Shoshone (38.4%, a difference of 0.070%), Immigrants from El Salvador (38.4%, a difference of 0.11%), Guatemalan (38.5%, a difference of 0.12%), and Colville (38.5%, a difference of 0.21%).
| Demographics | Rating | Rank | Associate's Degree |
| Cheyenne | 0.0 /100 | #298 | Tragic 38.7% |
| Ute | 0.0 /100 | #299 | Tragic 38.6% |
| Chickasaw | 0.0 /100 | #300 | Tragic 38.6% |
| Tsimshian | 0.0 /100 | #301 | Tragic 38.6% |
| Colville | 0.0 /100 | #302 | Tragic 38.5% |
| Guatemalans | 0.0 /100 | #303 | Tragic 38.5% |
| Sioux | 0.0 /100 | #304 | Tragic 38.5% |
| Immigrants | Honduras | 0.0 /100 | #305 | Tragic 38.5% |
| Shoshone | 0.0 /100 | #306 | Tragic 38.4% |
| Immigrants | El Salvador | 0.0 /100 | #307 | Tragic 38.4% |
| Mexican American Indians | 0.0 /100 | #308 | Tragic 38.2% |
| Immigrants | Guatemala | 0.0 /100 | #309 | Tragic 38.1% |
| Immigrants | Dominican Republic | 0.0 /100 | #310 | Tragic 37.9% |
| Immigrants | Latin America | 0.0 /100 | #311 | Tragic 37.9% |
| Choctaw | 0.0 /100 | #312 | Tragic 37.8% |