Costa Rican vs Immigrants from Switzerland Master's Degree
COMPARE
Costa Rican
Immigrants from Switzerland
Master's Degree
Master's Degree Comparison
Costa Ricans
Immigrants from Switzerland
15.0%
MASTER'S DEGREE
52.5/ 100
METRIC RATING
173rd/ 347
METRIC RANK
20.9%
MASTER'S DEGREE
100.0/ 100
METRIC RATING
14th/ 347
METRIC RANK
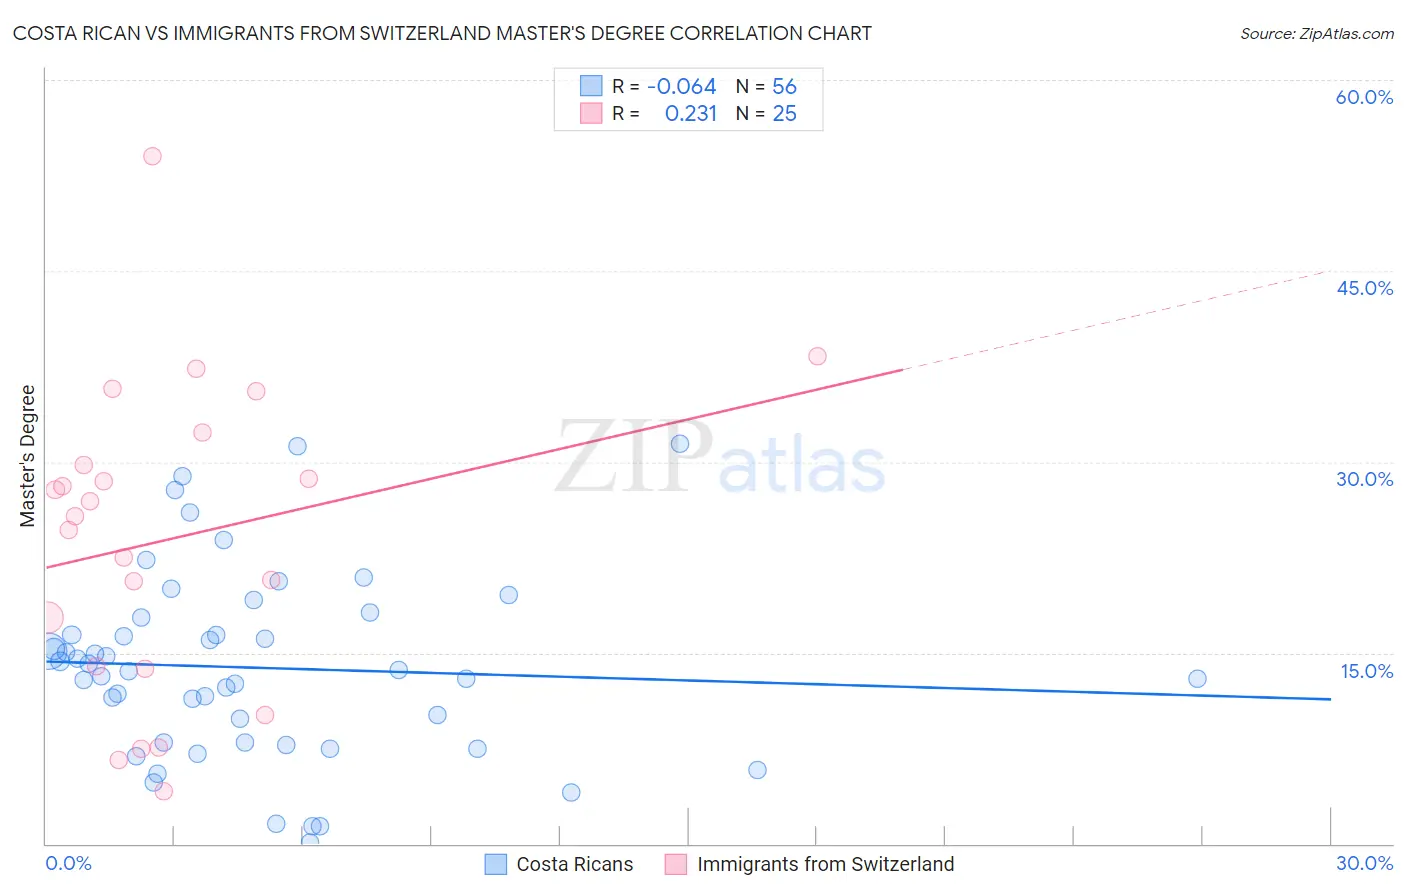
Costa Rican vs Immigrants from Switzerland Master's Degree Correlation Chart
The statistical analysis conducted on geographies consisting of 253,588,178 people shows a slight negative correlation between the proportion of Costa Ricans and percentage of population with at least master's degree education in the United States with a correlation coefficient (R) of -0.064 and weighted average of 15.0%. Similarly, the statistical analysis conducted on geographies consisting of 148,079,406 people shows a weak positive correlation between the proportion of Immigrants from Switzerland and percentage of population with at least master's degree education in the United States with a correlation coefficient (R) of 0.231 and weighted average of 20.9%, a difference of 39.4%.
Master's Degree Correlation Summary
| Measurement | Costa Rican | Immigrants from Switzerland |
| Minimum | 0.13% | 4.1% |
| Maximum | 31.4% | 54.0% |
| Range | 31.3% | 50.0% |
| Mean | 13.8% | 23.9% |
| Median | 13.6% | 25.7% |
| Interquartile 25% (IQ1) | 8.0% | 13.9% |
| Interquartile 75% (IQ3) | 17.1% | 31.0% |
| Interquartile Range (IQR) | 9.1% | 17.2% |
| Standard Deviation (Sample) | 7.3% | 12.0% |
| Standard Deviation (Population) | 7.2% | 11.7% |
Similar Demographics by Master's Degree
Demographics Similar to Costa Ricans by Master's Degree
In terms of master's degree, the demographic groups most similar to Costa Ricans are Immigrants from Uruguay (15.0%, a difference of 0.040%), Immigrants from Ghana (15.0%, a difference of 0.14%), Slovak (14.9%, a difference of 0.32%), Immigrants from Peru (14.9%, a difference of 0.36%), and Irish (15.0%, a difference of 0.50%).
| Demographics | Rating | Rank | Master's Degree |
| Swedes | 66.1 /100 | #166 | Good 15.2% |
| Senegalese | 65.6 /100 | #167 | Good 15.2% |
| Immigrants | North Macedonia | 64.5 /100 | #168 | Good 15.2% |
| Scottish | 62.7 /100 | #169 | Good 15.2% |
| Irish | 56.3 /100 | #170 | Average 15.0% |
| Immigrants | Ghana | 53.6 /100 | #171 | Average 15.0% |
| Immigrants | Uruguay | 52.8 /100 | #172 | Average 15.0% |
| Costa Ricans | 52.5 /100 | #173 | Average 15.0% |
| Slovaks | 50.0 /100 | #174 | Average 14.9% |
| Immigrants | Peru | 49.6 /100 | #175 | Average 14.9% |
| Nigerians | 48.6 /100 | #176 | Average 14.9% |
| Immigrants | Colombia | 48.3 /100 | #177 | Average 14.9% |
| English | 45.0 /100 | #178 | Average 14.8% |
| Immigrants | Iraq | 41.3 /100 | #179 | Average 14.8% |
| Celtics | 41.3 /100 | #180 | Average 14.8% |
Demographics Similar to Immigrants from Switzerland by Master's Degree
In terms of master's degree, the demographic groups most similar to Immigrants from Switzerland are Immigrants from Australia (20.9%, a difference of 0.010%), Immigrants from Eastern Asia (20.8%, a difference of 0.18%), Immigrants from Belgium (20.8%, a difference of 0.47%), Immigrants from South Central Asia (20.7%, a difference of 0.73%), and Eastern European (21.1%, a difference of 1.2%).
| Demographics | Rating | Rank | Master's Degree |
| Iranians | 100.0 /100 | #7 | Exceptional 22.3% |
| Cypriots | 100.0 /100 | #8 | Exceptional 21.8% |
| Thais | 100.0 /100 | #9 | Exceptional 21.7% |
| Immigrants | Iran | 100.0 /100 | #10 | Exceptional 21.6% |
| Immigrants | China | 100.0 /100 | #11 | Exceptional 21.2% |
| Eastern Europeans | 100.0 /100 | #12 | Exceptional 21.1% |
| Immigrants | Australia | 100.0 /100 | #13 | Exceptional 20.9% |
| Immigrants | Switzerland | 100.0 /100 | #14 | Exceptional 20.9% |
| Immigrants | Eastern Asia | 100.0 /100 | #15 | Exceptional 20.8% |
| Immigrants | Belgium | 100.0 /100 | #16 | Exceptional 20.8% |
| Immigrants | South Central Asia | 100.0 /100 | #17 | Exceptional 20.7% |
| Soviet Union | 100.0 /100 | #18 | Exceptional 20.5% |
| Immigrants | Hong Kong | 100.0 /100 | #19 | Exceptional 20.5% |
| Indians (Asian) | 100.0 /100 | #20 | Exceptional 20.5% |
| Immigrants | Ireland | 100.0 /100 | #21 | Exceptional 20.4% |