Maltese vs Immigrants from Switzerland Master's Degree
COMPARE
Maltese
Immigrants from Switzerland
Master's Degree
Master's Degree Comparison
Maltese
Immigrants from Switzerland
17.3%
MASTER'S DEGREE
99.3/ 100
METRIC RATING
87th/ 347
METRIC RANK
20.9%
MASTER'S DEGREE
100.0/ 100
METRIC RATING
14th/ 347
METRIC RANK
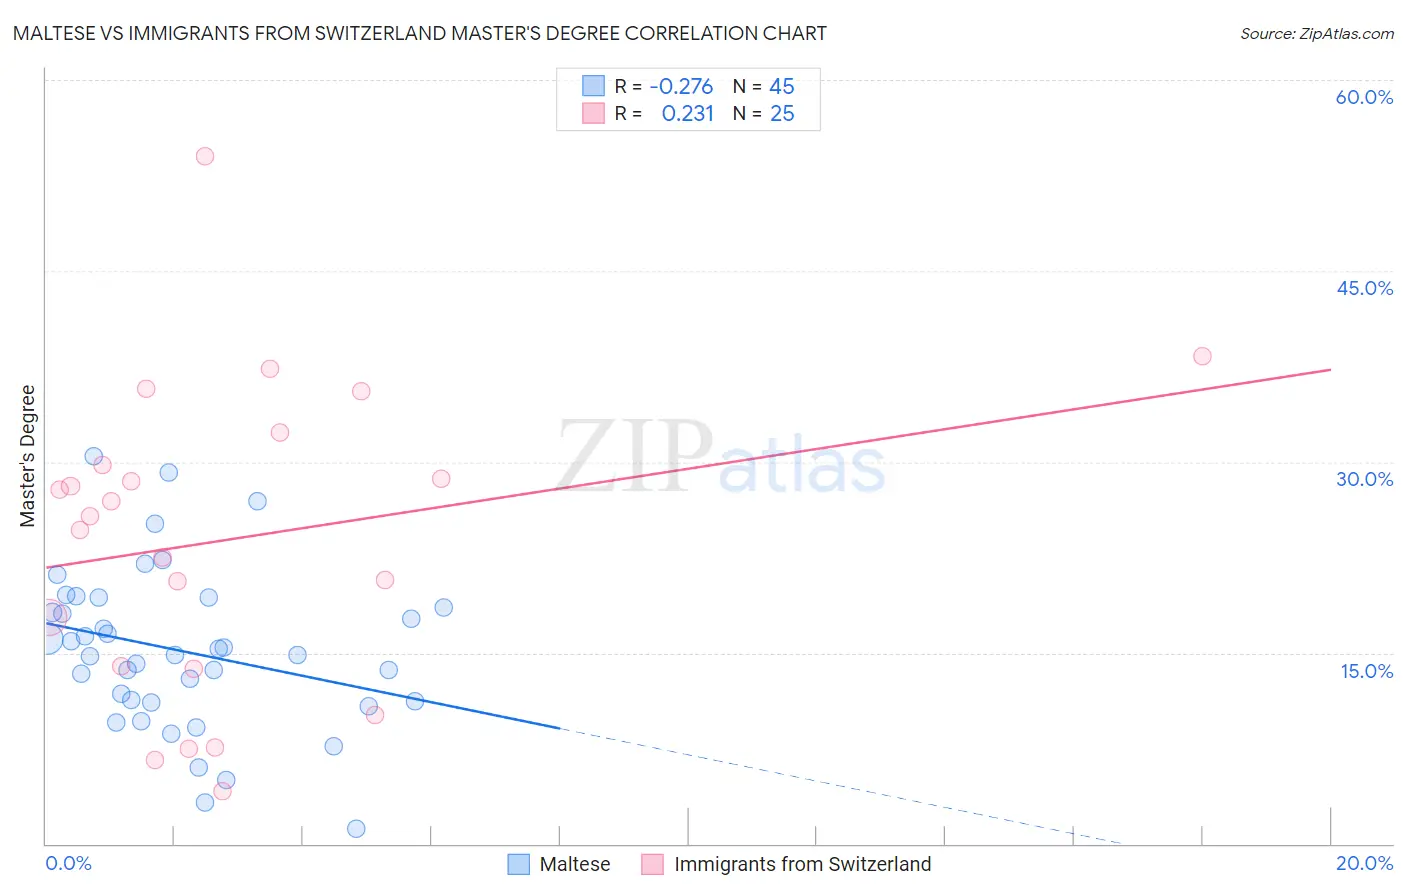
Maltese vs Immigrants from Switzerland Master's Degree Correlation Chart
The statistical analysis conducted on geographies consisting of 126,460,442 people shows a weak negative correlation between the proportion of Maltese and percentage of population with at least master's degree education in the United States with a correlation coefficient (R) of -0.276 and weighted average of 17.3%. Similarly, the statistical analysis conducted on geographies consisting of 148,079,406 people shows a weak positive correlation between the proportion of Immigrants from Switzerland and percentage of population with at least master's degree education in the United States with a correlation coefficient (R) of 0.231 and weighted average of 20.9%, a difference of 20.9%.
Master's Degree Correlation Summary
| Measurement | Maltese | Immigrants from Switzerland |
| Minimum | 1.2% | 4.1% |
| Maximum | 30.4% | 54.0% |
| Range | 29.2% | 50.0% |
| Mean | 15.1% | 23.9% |
| Median | 14.8% | 25.7% |
| Interquartile 25% (IQ1) | 11.1% | 13.9% |
| Interquartile 75% (IQ3) | 18.9% | 31.0% |
| Interquartile Range (IQR) | 7.8% | 17.2% |
| Standard Deviation (Sample) | 6.3% | 12.0% |
| Standard Deviation (Population) | 6.2% | 11.7% |
Similar Demographics by Master's Degree
Demographics Similar to Maltese by Master's Degree
In terms of master's degree, the demographic groups most similar to Maltese are Immigrants from Croatia (17.3%, a difference of 0.10%), Immigrants from Canada (17.2%, a difference of 0.36%), Bhutanese (17.2%, a difference of 0.43%), Immigrants from Egypt (17.2%, a difference of 0.45%), and Immigrants from Brazil (17.4%, a difference of 0.51%).
| Demographics | Rating | Rank | Master's Degree |
| Carpatho Rusyns | 99.6 /100 | #80 | Exceptional 17.5% |
| Immigrants | Western Asia | 99.5 /100 | #81 | Exceptional 17.5% |
| Greeks | 99.5 /100 | #82 | Exceptional 17.5% |
| Immigrants | Zimbabwe | 99.5 /100 | #83 | Exceptional 17.4% |
| Immigrants | Scotland | 99.4 /100 | #84 | Exceptional 17.4% |
| Immigrants | Brazil | 99.4 /100 | #85 | Exceptional 17.4% |
| Immigrants | Croatia | 99.3 /100 | #86 | Exceptional 17.3% |
| Maltese | 99.3 /100 | #87 | Exceptional 17.3% |
| Immigrants | Canada | 99.2 /100 | #88 | Exceptional 17.2% |
| Bhutanese | 99.1 /100 | #89 | Exceptional 17.2% |
| Immigrants | Egypt | 99.1 /100 | #90 | Exceptional 17.2% |
| Romanians | 99.1 /100 | #91 | Exceptional 17.2% |
| Immigrants | North America | 99.1 /100 | #92 | Exceptional 17.2% |
| Immigrants | Italy | 99.1 /100 | #93 | Exceptional 17.2% |
| Ugandans | 99.0 /100 | #94 | Exceptional 17.1% |
Demographics Similar to Immigrants from Switzerland by Master's Degree
In terms of master's degree, the demographic groups most similar to Immigrants from Switzerland are Immigrants from Australia (20.9%, a difference of 0.010%), Immigrants from Eastern Asia (20.8%, a difference of 0.18%), Immigrants from Belgium (20.8%, a difference of 0.47%), Immigrants from South Central Asia (20.7%, a difference of 0.73%), and Eastern European (21.1%, a difference of 1.2%).
| Demographics | Rating | Rank | Master's Degree |
| Iranians | 100.0 /100 | #7 | Exceptional 22.3% |
| Cypriots | 100.0 /100 | #8 | Exceptional 21.8% |
| Thais | 100.0 /100 | #9 | Exceptional 21.7% |
| Immigrants | Iran | 100.0 /100 | #10 | Exceptional 21.6% |
| Immigrants | China | 100.0 /100 | #11 | Exceptional 21.2% |
| Eastern Europeans | 100.0 /100 | #12 | Exceptional 21.1% |
| Immigrants | Australia | 100.0 /100 | #13 | Exceptional 20.9% |
| Immigrants | Switzerland | 100.0 /100 | #14 | Exceptional 20.9% |
| Immigrants | Eastern Asia | 100.0 /100 | #15 | Exceptional 20.8% |
| Immigrants | Belgium | 100.0 /100 | #16 | Exceptional 20.8% |
| Immigrants | South Central Asia | 100.0 /100 | #17 | Exceptional 20.7% |
| Soviet Union | 100.0 /100 | #18 | Exceptional 20.5% |
| Immigrants | Hong Kong | 100.0 /100 | #19 | Exceptional 20.5% |
| Indians (Asian) | 100.0 /100 | #20 | Exceptional 20.5% |
| Immigrants | Ireland | 100.0 /100 | #21 | Exceptional 20.4% |