Panamanian vs Immigrants from Grenada 10th Grade
COMPARE
Panamanian
Immigrants from Grenada
10th Grade
10th Grade Comparison
Panamanians
Immigrants from Grenada
93.5%
10TH GRADE
28.0/ 100
METRIC RATING
193rd/ 347
METRIC RANK
91.6%
10TH GRADE
0.0/ 100
METRIC RATING
296th/ 347
METRIC RANK
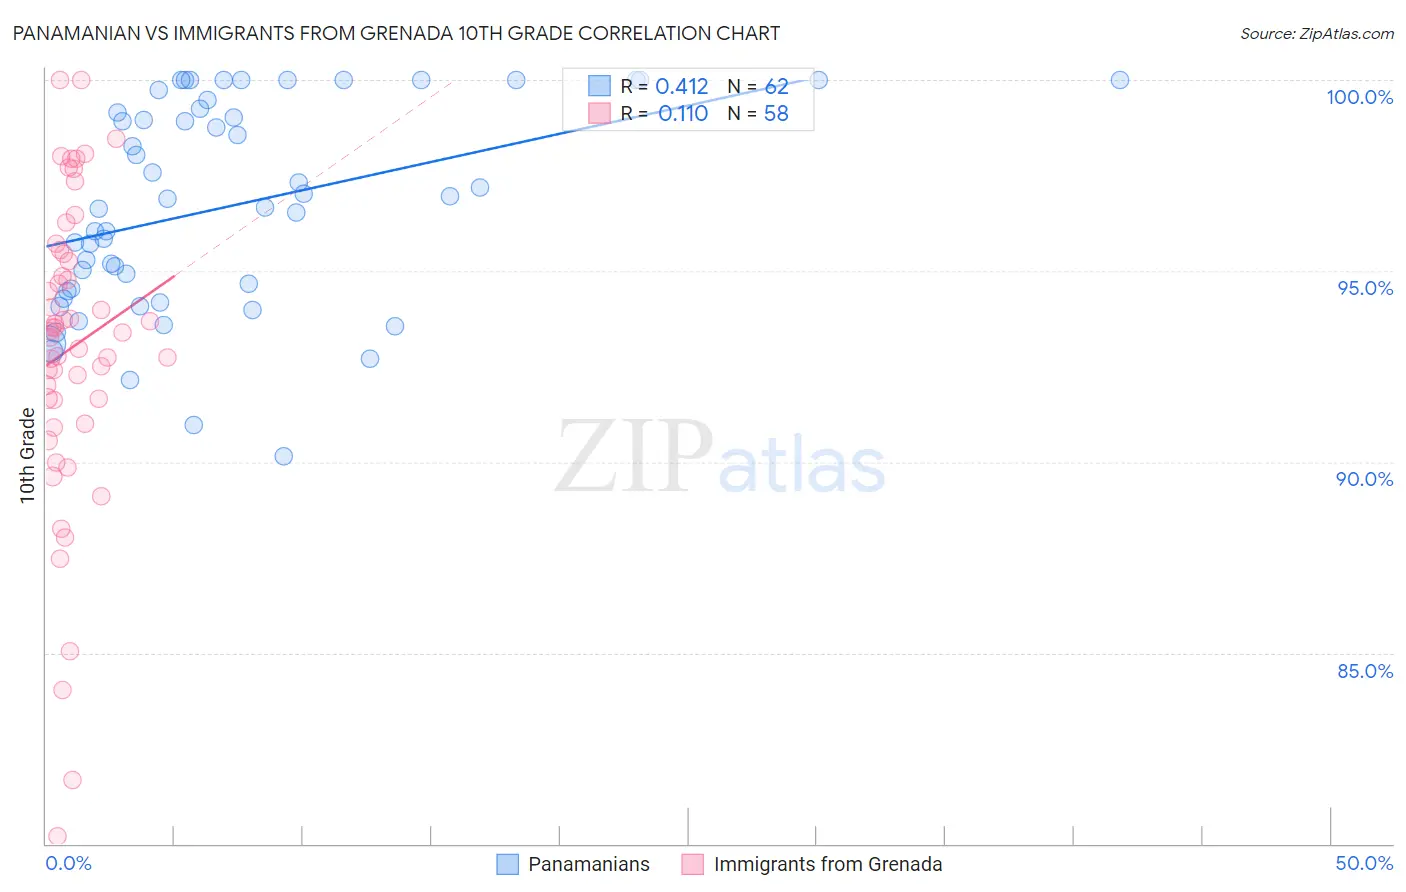
Panamanian vs Immigrants from Grenada 10th Grade Correlation Chart
The statistical analysis conducted on geographies consisting of 281,248,945 people shows a moderate positive correlation between the proportion of Panamanians and percentage of population with at least 10th grade education in the United States with a correlation coefficient (R) of 0.412 and weighted average of 93.5%. Similarly, the statistical analysis conducted on geographies consisting of 67,199,790 people shows a poor positive correlation between the proportion of Immigrants from Grenada and percentage of population with at least 10th grade education in the United States with a correlation coefficient (R) of 0.110 and weighted average of 91.6%, a difference of 2.1%.
10th Grade Correlation Summary
| Measurement | Panamanian | Immigrants from Grenada |
| Minimum | 90.1% | 80.2% |
| Maximum | 100.0% | 100.0% |
| Range | 9.9% | 19.8% |
| Mean | 96.7% | 93.0% |
| Median | 96.8% | 93.4% |
| Interquartile 25% (IQ1) | 94.5% | 91.6% |
| Interquartile 75% (IQ3) | 99.2% | 95.4% |
| Interquartile Range (IQR) | 4.8% | 3.8% |
| Standard Deviation (Sample) | 2.7% | 4.1% |
| Standard Deviation (Population) | 2.7% | 4.0% |
Similar Demographics by 10th Grade
Demographics Similar to Panamanians by 10th Grade
In terms of 10th grade, the demographic groups most similar to Panamanians are Immigrants from Malaysia (93.5%, a difference of 0.0%), Immigrants from Morocco (93.5%, a difference of 0.010%), Cheyenne (93.5%, a difference of 0.010%), Yup'ik (93.6%, a difference of 0.030%), and Moroccan (93.5%, a difference of 0.030%).
| Demographics | Rating | Rank | 10th Grade |
| Immigrants | Eastern Asia | 35.1 /100 | #186 | Fair 93.6% |
| Liberians | 34.7 /100 | #187 | Fair 93.6% |
| Marshallese | 33.2 /100 | #188 | Fair 93.6% |
| Immigrants | Pakistan | 32.5 /100 | #189 | Fair 93.6% |
| Laotians | 32.1 /100 | #190 | Fair 93.6% |
| Yup'ik | 31.1 /100 | #191 | Fair 93.6% |
| Immigrants | Malaysia | 28.0 /100 | #192 | Fair 93.5% |
| Panamanians | 28.0 /100 | #193 | Fair 93.5% |
| Immigrants | Morocco | 26.9 /100 | #194 | Fair 93.5% |
| Cheyenne | 26.8 /100 | #195 | Fair 93.5% |
| Moroccans | 25.3 /100 | #196 | Fair 93.5% |
| Pueblo | 23.9 /100 | #197 | Fair 93.5% |
| Immigrants | Micronesia | 23.2 /100 | #198 | Fair 93.5% |
| Asians | 23.0 /100 | #199 | Fair 93.5% |
| Hopi | 22.2 /100 | #200 | Fair 93.5% |
Demographics Similar to Immigrants from Grenada by 10th Grade
In terms of 10th grade, the demographic groups most similar to Immigrants from Grenada are Lumbee (91.7%, a difference of 0.13%), Fijian (91.5%, a difference of 0.14%), Haitian (91.8%, a difference of 0.15%), Cuban (91.5%, a difference of 0.17%), and Indonesian (91.8%, a difference of 0.19%).
| Demographics | Rating | Rank | 10th Grade |
| Sri Lankans | 0.0 /100 | #289 | Tragic 91.8% |
| British West Indians | 0.0 /100 | #290 | Tragic 91.8% |
| Immigrants | West Indies | 0.0 /100 | #291 | Tragic 91.8% |
| Immigrants | Burma/Myanmar | 0.0 /100 | #292 | Tragic 91.8% |
| Indonesians | 0.0 /100 | #293 | Tragic 91.8% |
| Haitians | 0.0 /100 | #294 | Tragic 91.8% |
| Lumbee | 0.0 /100 | #295 | Tragic 91.7% |
| Immigrants | Grenada | 0.0 /100 | #296 | Tragic 91.6% |
| Fijians | 0.0 /100 | #297 | Tragic 91.5% |
| Cubans | 0.0 /100 | #298 | Tragic 91.5% |
| Immigrants | Haiti | 0.0 /100 | #299 | Tragic 91.4% |
| Guyanese | 0.0 /100 | #300 | Tragic 91.4% |
| Japanese | 0.0 /100 | #301 | Tragic 91.2% |
| Immigrants | Guyana | 0.0 /100 | #302 | Tragic 91.2% |
| Immigrants | Vietnam | 0.0 /100 | #303 | Tragic 91.2% |