Palestinian vs Immigrants from Trinidad and Tobago Family Poverty
COMPARE
Palestinian
Immigrants from Trinidad and Tobago
Family Poverty
Family Poverty Comparison
Palestinians
Immigrants from Trinidad and Tobago
8.3%
FAMILY POVERTY
91.1/ 100
METRIC RATING
123rd/ 347
METRIC RANK
10.9%
FAMILY POVERTY
0.1/ 100
METRIC RATING
265th/ 347
METRIC RANK
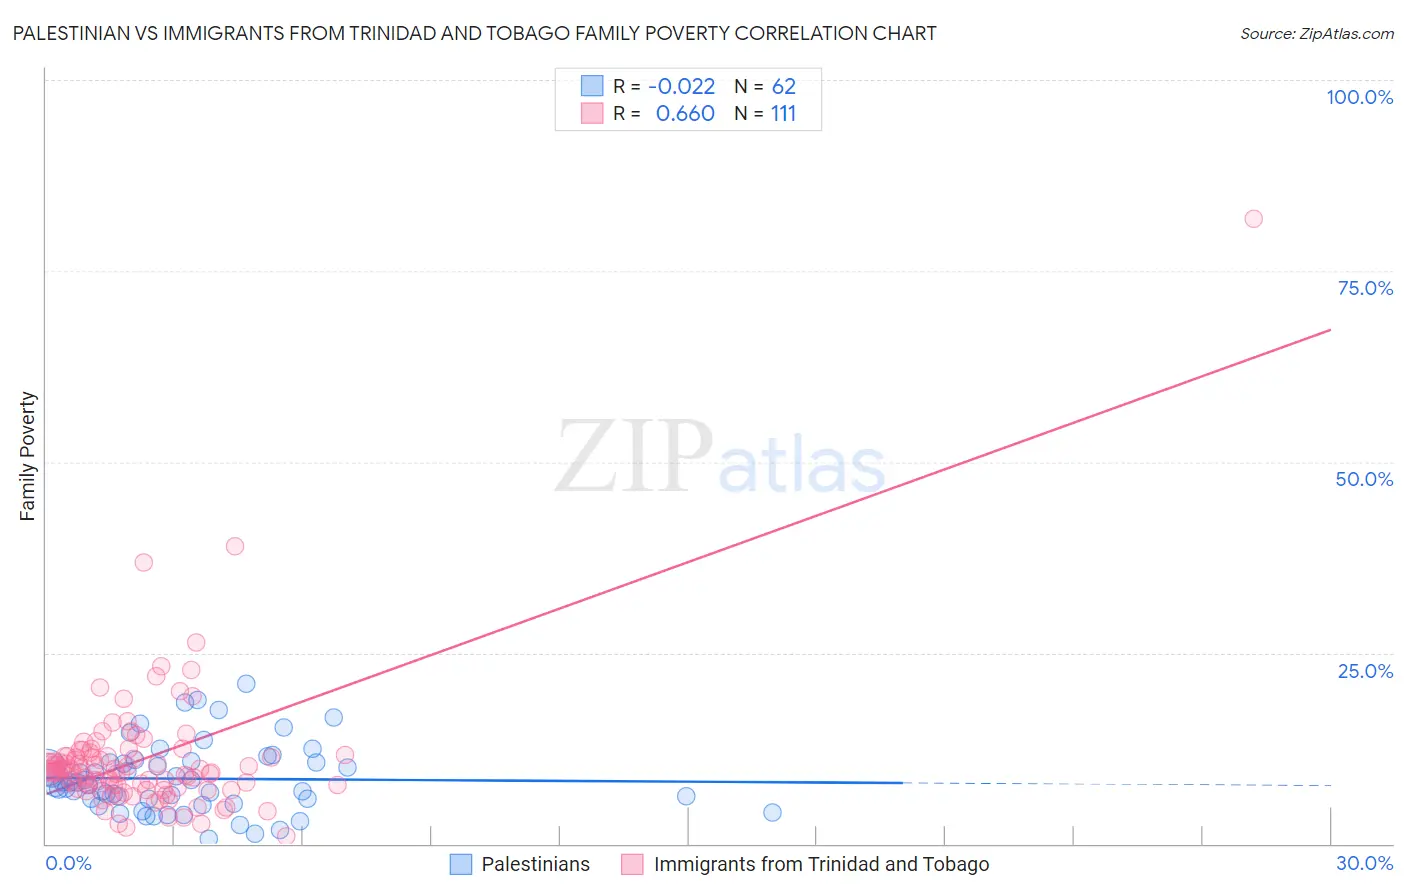
Palestinian vs Immigrants from Trinidad and Tobago Family Poverty Correlation Chart
The statistical analysis conducted on geographies consisting of 216,211,799 people shows no correlation between the proportion of Palestinians and poverty level among families in the United States with a correlation coefficient (R) of -0.022 and weighted average of 8.3%. Similarly, the statistical analysis conducted on geographies consisting of 223,249,707 people shows a significant positive correlation between the proportion of Immigrants from Trinidad and Tobago and poverty level among families in the United States with a correlation coefficient (R) of 0.660 and weighted average of 10.9%, a difference of 31.6%.
Family Poverty Correlation Summary
| Measurement | Palestinian | Immigrants from Trinidad and Tobago |
| Minimum | 0.67% | 1.1% |
| Maximum | 21.0% | 81.8% |
| Range | 20.3% | 80.8% |
| Mean | 8.5% | 11.1% |
| Median | 7.9% | 9.4% |
| Interquartile 25% (IQ1) | 5.8% | 7.6% |
| Interquartile 75% (IQ3) | 10.7% | 11.5% |
| Interquartile Range (IQR) | 4.9% | 3.9% |
| Standard Deviation (Sample) | 4.5% | 8.9% |
| Standard Deviation (Population) | 4.4% | 8.9% |
Similar Demographics by Family Poverty
Demographics Similar to Palestinians by Family Poverty
In terms of family poverty, the demographic groups most similar to Palestinians are Paraguayan (8.3%, a difference of 0.070%), Native Hawaiian (8.3%, a difference of 0.080%), Soviet Union (8.3%, a difference of 0.10%), Pakistani (8.3%, a difference of 0.14%), and Immigrants from Egypt (8.3%, a difference of 0.25%).
| Demographics | Rating | Rank | Family Poverty |
| South Africans | 93.4 /100 | #116 | Exceptional 8.2% |
| Immigrants | Russia | 93.2 /100 | #117 | Exceptional 8.2% |
| Immigrants | Western Europe | 92.9 /100 | #118 | Exceptional 8.2% |
| French | 92.8 /100 | #119 | Exceptional 8.3% |
| Immigrants | Egypt | 91.6 /100 | #120 | Exceptional 8.3% |
| Native Hawaiians | 91.3 /100 | #121 | Exceptional 8.3% |
| Paraguayans | 91.2 /100 | #122 | Exceptional 8.3% |
| Palestinians | 91.1 /100 | #123 | Exceptional 8.3% |
| Soviet Union | 90.8 /100 | #124 | Exceptional 8.3% |
| Pakistanis | 90.8 /100 | #125 | Exceptional 8.3% |
| Icelanders | 90.3 /100 | #126 | Exceptional 8.3% |
| Immigrants | Hungary | 89.9 /100 | #127 | Excellent 8.4% |
| Argentineans | 89.6 /100 | #128 | Excellent 8.4% |
| Portuguese | 89.2 /100 | #129 | Excellent 8.4% |
| Immigrants | Bosnia and Herzegovina | 88.6 /100 | #130 | Excellent 8.4% |
Demographics Similar to Immigrants from Trinidad and Tobago by Family Poverty
In terms of family poverty, the demographic groups most similar to Immigrants from Trinidad and Tobago are Trinidadian and Tobagonian (10.9%, a difference of 0.060%), Cape Verdean (10.9%, a difference of 0.070%), Spanish American Indian (10.9%, a difference of 0.33%), Shoshone (10.9%, a difference of 0.46%), and Bangladeshi (10.9%, a difference of 0.50%).
| Demographics | Rating | Rank | Family Poverty |
| Sub-Saharan Africans | 0.2 /100 | #258 | Tragic 10.9% |
| Mexican American Indians | 0.2 /100 | #259 | Tragic 10.9% |
| Bangladeshis | 0.2 /100 | #260 | Tragic 10.9% |
| Shoshone | 0.2 /100 | #261 | Tragic 10.9% |
| Spanish American Indians | 0.2 /100 | #262 | Tragic 10.9% |
| Cape Verdeans | 0.1 /100 | #263 | Tragic 10.9% |
| Trinidadians and Tobagonians | 0.1 /100 | #264 | Tragic 10.9% |
| Immigrants | Trinidad and Tobago | 0.1 /100 | #265 | Tragic 10.9% |
| Immigrants | El Salvador | 0.1 /100 | #266 | Tragic 11.0% |
| Comanche | 0.1 /100 | #267 | Tragic 11.0% |
| Jamaicans | 0.1 /100 | #268 | Tragic 11.1% |
| Immigrants | Ecuador | 0.1 /100 | #269 | Tragic 11.1% |
| Immigrants | Nicaragua | 0.1 /100 | #270 | Tragic 11.1% |
| Immigrants | Bahamas | 0.1 /100 | #271 | Tragic 11.1% |
| Immigrants | Jamaica | 0.1 /100 | #272 | Tragic 11.2% |