Palestinian vs Immigrants from Trinidad and Tobago In Labor Force | Age 30-34
COMPARE
Palestinian
Immigrants from Trinidad and Tobago
In Labor Force | Age 30-34
In Labor Force | Age 30-34 Comparison
Palestinians
Immigrants from Trinidad and Tobago
84.9%
IN LABOR FORCE | AGE 30-34
77.7/ 100
METRIC RATING
145th/ 347
METRIC RANK
84.3%
IN LABOR FORCE | AGE 30-34
7.0/ 100
METRIC RATING
217th/ 347
METRIC RANK
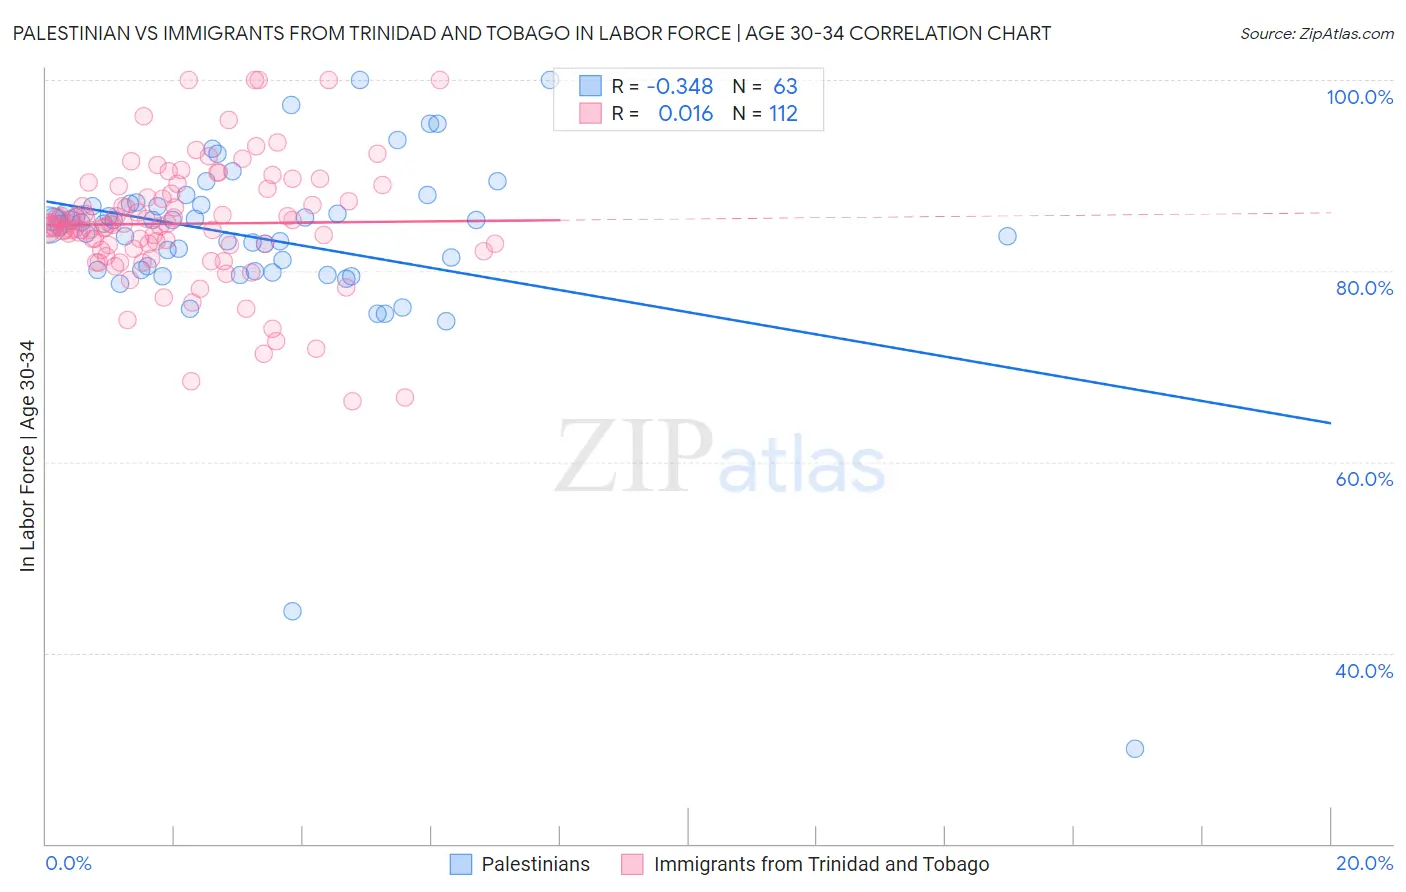
Palestinian vs Immigrants from Trinidad and Tobago In Labor Force | Age 30-34 Correlation Chart
The statistical analysis conducted on geographies consisting of 216,407,612 people shows a mild negative correlation between the proportion of Palestinians and labor force participation rate among population between the ages 30 and 34 in the United States with a correlation coefficient (R) of -0.348 and weighted average of 84.9%. Similarly, the statistical analysis conducted on geographies consisting of 223,505,826 people shows no correlation between the proportion of Immigrants from Trinidad and Tobago and labor force participation rate among population between the ages 30 and 34 in the United States with a correlation coefficient (R) of 0.016 and weighted average of 84.3%, a difference of 0.68%.
In Labor Force | Age 30-34 Correlation Summary
| Measurement | Palestinian | Immigrants from Trinidad and Tobago |
| Minimum | 30.0% | 66.4% |
| Maximum | 100.0% | 100.0% |
| Range | 70.0% | 33.6% |
| Mean | 83.4% | 84.9% |
| Median | 84.9% | 84.8% |
| Interquartile 25% (IQ1) | 80.1% | 82.6% |
| Interquartile 75% (IQ3) | 86.9% | 87.9% |
| Interquartile Range (IQR) | 6.8% | 5.4% |
| Standard Deviation (Sample) | 10.2% | 6.3% |
| Standard Deviation (Population) | 10.1% | 6.3% |
Similar Demographics by In Labor Force | Age 30-34
Demographics Similar to Palestinians by In Labor Force | Age 30-34
In terms of in labor force | age 30-34, the demographic groups most similar to Palestinians are Uruguayan (84.9%, a difference of 0.010%), Immigrants from Saudi Arabia (84.9%, a difference of 0.010%), Immigrants from Colombia (84.9%, a difference of 0.010%), Immigrants from Pakistan (84.9%, a difference of 0.010%), and Immigrants from Ukraine (84.8%, a difference of 0.020%).
| Demographics | Rating | Rank | In Labor Force | Age 30-34 |
| Sri Lankans | 87.8 /100 | #138 | Excellent 85.0% |
| Bhutanese | 87.5 /100 | #139 | Excellent 85.0% |
| Immigrants | Vietnam | 86.5 /100 | #140 | Excellent 85.0% |
| Chileans | 85.3 /100 | #141 | Excellent 84.9% |
| Immigrants | Indonesia | 84.3 /100 | #142 | Excellent 84.9% |
| Colombians | 82.2 /100 | #143 | Excellent 84.9% |
| Uruguayans | 78.5 /100 | #144 | Good 84.9% |
| Palestinians | 77.7 /100 | #145 | Good 84.9% |
| Immigrants | Saudi Arabia | 76.6 /100 | #146 | Good 84.9% |
| Immigrants | Colombia | 76.3 /100 | #147 | Good 84.9% |
| Immigrants | Pakistan | 76.2 /100 | #148 | Good 84.9% |
| Immigrants | Ukraine | 75.1 /100 | #149 | Good 84.8% |
| Germans | 75.1 /100 | #150 | Good 84.8% |
| Immigrants | Senegal | 74.0 /100 | #151 | Good 84.8% |
| Romanians | 73.5 /100 | #152 | Good 84.8% |
Demographics Similar to Immigrants from Trinidad and Tobago by In Labor Force | Age 30-34
In terms of in labor force | age 30-34, the demographic groups most similar to Immigrants from Trinidad and Tobago are Immigrants from Ecuador (84.3%, a difference of 0.0%), Immigrants from Germany (84.3%, a difference of 0.010%), European (84.3%, a difference of 0.010%), Immigrants from Jamaica (84.3%, a difference of 0.020%), and Immigrants from Panama (84.3%, a difference of 0.020%).
| Demographics | Rating | Rank | In Labor Force | Age 30-34 |
| Indonesians | 8.8 /100 | #210 | Tragic 84.3% |
| Japanese | 8.8 /100 | #211 | Tragic 84.3% |
| Immigrants | Western Asia | 8.2 /100 | #212 | Tragic 84.3% |
| Immigrants | Jamaica | 7.9 /100 | #213 | Tragic 84.3% |
| Immigrants | Germany | 7.2 /100 | #214 | Tragic 84.3% |
| Europeans | 7.2 /100 | #215 | Tragic 84.3% |
| Immigrants | Ecuador | 7.1 /100 | #216 | Tragic 84.3% |
| Immigrants | Trinidad and Tobago | 7.0 /100 | #217 | Tragic 84.3% |
| Immigrants | Panama | 6.3 /100 | #218 | Tragic 84.3% |
| Swiss | 5.8 /100 | #219 | Tragic 84.3% |
| Danes | 5.3 /100 | #220 | Tragic 84.3% |
| Salvadorans | 3.8 /100 | #221 | Tragic 84.2% |
| Panamanians | 3.8 /100 | #222 | Tragic 84.2% |
| Immigrants | Laos | 3.6 /100 | #223 | Tragic 84.2% |
| Cubans | 3.4 /100 | #224 | Tragic 84.2% |