Apache vs Immigrants from Nicaragua Master's Degree
COMPARE
Apache
Immigrants from Nicaragua
Master's Degree
Master's Degree Comparison
Apache
Immigrants from Nicaragua
11.0%
MASTER'S DEGREE
0.0/ 100
METRIC RATING
315th/ 347
METRIC RANK
11.8%
MASTER'S DEGREE
0.2/ 100
METRIC RATING
285th/ 347
METRIC RANK
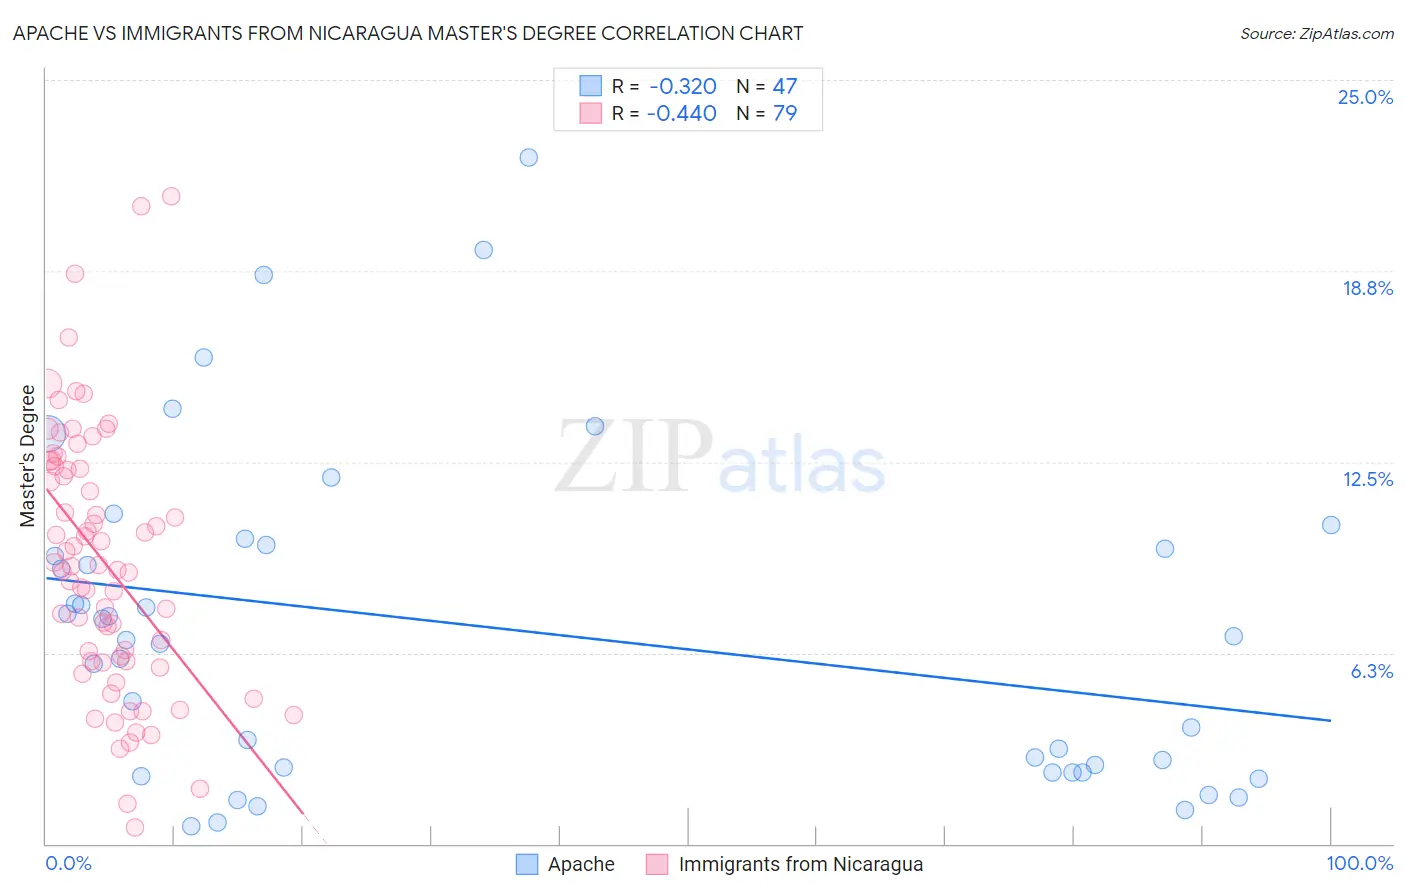
Apache vs Immigrants from Nicaragua Master's Degree Correlation Chart
The statistical analysis conducted on geographies consisting of 231,057,413 people shows a mild negative correlation between the proportion of Apache and percentage of population with at least master's degree education in the United States with a correlation coefficient (R) of -0.320 and weighted average of 11.0%. Similarly, the statistical analysis conducted on geographies consisting of 236,327,248 people shows a moderate negative correlation between the proportion of Immigrants from Nicaragua and percentage of population with at least master's degree education in the United States with a correlation coefficient (R) of -0.440 and weighted average of 11.8%, a difference of 8.0%.
Master's Degree Correlation Summary
| Measurement | Apache | Immigrants from Nicaragua |
| Minimum | 0.59% | 0.53% |
| Maximum | 22.5% | 21.2% |
| Range | 21.9% | 20.7% |
| Mean | 7.0% | 9.2% |
| Median | 6.7% | 9.1% |
| Interquartile 25% (IQ1) | 2.3% | 6.0% |
| Interquartile 75% (IQ3) | 9.8% | 12.4% |
| Interquartile Range (IQR) | 7.4% | 6.4% |
| Standard Deviation (Sample) | 5.3% | 4.3% |
| Standard Deviation (Population) | 5.3% | 4.3% |
Similar Demographics by Master's Degree
Demographics Similar to Apache by Master's Degree
In terms of master's degree, the demographic groups most similar to Apache are Cajun (11.0%, a difference of 0.0%), Hispanic or Latino (10.9%, a difference of 0.34%), Yaqui (11.0%, a difference of 0.40%), Choctaw (11.0%, a difference of 0.58%), and Seminole (11.0%, a difference of 0.67%).
| Demographics | Rating | Rank | Master's Degree |
| Puerto Ricans | 0.0 /100 | #308 | Tragic 11.2% |
| Puget Sound Salish | 0.0 /100 | #309 | Tragic 11.1% |
| Shoshone | 0.0 /100 | #310 | Tragic 11.1% |
| Seminole | 0.0 /100 | #311 | Tragic 11.0% |
| Choctaw | 0.0 /100 | #312 | Tragic 11.0% |
| Yaqui | 0.0 /100 | #313 | Tragic 11.0% |
| Cajuns | 0.0 /100 | #314 | Tragic 11.0% |
| Apache | 0.0 /100 | #315 | Tragic 11.0% |
| Hispanics or Latinos | 0.0 /100 | #316 | Tragic 10.9% |
| Hopi | 0.0 /100 | #317 | Tragic 10.9% |
| Immigrants | Cuba | 0.0 /100 | #318 | Tragic 10.9% |
| Kiowa | 0.0 /100 | #319 | Tragic 10.8% |
| Immigrants | Micronesia | 0.0 /100 | #320 | Tragic 10.8% |
| Pennsylvania Germans | 0.0 /100 | #321 | Tragic 10.7% |
| Sioux | 0.0 /100 | #322 | Tragic 10.7% |
Demographics Similar to Immigrants from Nicaragua by Master's Degree
In terms of master's degree, the demographic groups most similar to Immigrants from Nicaragua are Ottawa (11.9%, a difference of 0.18%), Aleut (11.8%, a difference of 0.35%), Immigrants from Haiti (11.8%, a difference of 0.55%), Immigrants from Honduras (11.8%, a difference of 0.72%), and Guatemalan (11.7%, a difference of 0.80%).
| Demographics | Rating | Rank | Master's Degree |
| Potawatomi | 0.3 /100 | #278 | Tragic 12.1% |
| Immigrants | Belize | 0.2 /100 | #279 | Tragic 12.1% |
| Immigrants | Dominican Republic | 0.2 /100 | #280 | Tragic 12.1% |
| Malaysians | 0.2 /100 | #281 | Tragic 12.0% |
| Immigrants | El Salvador | 0.2 /100 | #282 | Tragic 12.0% |
| Hondurans | 0.2 /100 | #283 | Tragic 11.9% |
| Ottawa | 0.2 /100 | #284 | Tragic 11.9% |
| Immigrants | Nicaragua | 0.2 /100 | #285 | Tragic 11.8% |
| Aleuts | 0.1 /100 | #286 | Tragic 11.8% |
| Immigrants | Haiti | 0.1 /100 | #287 | Tragic 11.8% |
| Immigrants | Honduras | 0.1 /100 | #288 | Tragic 11.8% |
| Guatemalans | 0.1 /100 | #289 | Tragic 11.7% |
| Ute | 0.1 /100 | #290 | Tragic 11.7% |
| Colville | 0.1 /100 | #291 | Tragic 11.6% |
| Immigrants | Guatemala | 0.1 /100 | #292 | Tragic 11.6% |