Egyptian vs Immigrants from Nicaragua Master's Degree

COMPARE

Egyptian
Race
Ancestry
AfghanAfricanAlaska NativeAlaskan AthabascanAlbanianAleutAlsatianAmericanApacheArabArapahoArgentineanArmenianAssyrian/Chaldean/SyriacAustralianAustrianBahamianBangladeshiBarbadianBasqueBelgianBelizeanBermudanBhutaneseBlackfeetBolivianBrazilianBritishBritish West IndianBulgarianBurmeseCajunCambodianCanadianCape VerdeanCarpatho RusynCelticCentral AmericanCentral American IndianCherokeeCheyenneChickasawChileanChineseChippewaChoctawColombianColvilleComancheCosta RicanCreeCreekCroatianCrowCubanCypriotCzechCzechoslovakianDanishDelawareDominicanDutchDutch West IndianEastern EuropeanEcuadorianEgyptianEnglishEstonianEthiopianEuropeanFijianFilipinoFinnishFrenchFrench American IndianFrench CanadianGermanGerman RussianGhanaianGreekGuamanian/ChamorroGuatemalanGuyaneseHaitianHmongHonduranHopiHoumaHungarianIcelanderIndian (Asian)IndonesianInupiatIranianIraqiIrishIroquoisIsraeliItalianJamaicanJapaneseJordanianKenyanKiowaKoreanLaotianLatvianLebaneseLiberianLithuanianLumbeeLuxembourgerMacedonianMalaysianMalteseMarshalleseMenomineeMexicanMexican American IndianMongolianMoroccanNative HawaiianNavajoNepaleseNew ZealanderNicaraguanNigerianNorthern EuropeanNorwegianOkinawanOsageOttawaPaiutePakistaniPalestinianPanamanianParaguayanPennsylvania GermanPeruvianPimaPolishPortuguesePotawatomiPuebloPuerto RicanPuget Sound SalishRomanianRussianSalvadoranSamoanScandinavianScotch-IrishScottishSeminoleSenegaleseSerbianShoshoneSierra LeoneanSiouxSlavicSlovakSloveneSomaliSouth AfricanSouth AmericanSouth American IndianSoviet UnionSpaniardSpanishSpanish AmericanSpanish American IndianSri LankanSubsaharan AfricanSudaneseSwedishSwissSyrianTaiwaneseThaiTlingit-HaidaTohono O'OdhamTonganTrinidadian and TobagonianTsimshianTurkishU.S. Virgin IslanderUgandanUkrainianUruguayanUteVenezuelanVietnameseWelshWest IndianYakamaYaquiYugoslavianYumanYup'ikZimbabwean
Immigration
NonimmigrantsImmigrantsAfghanistanAfricaAlbaniaArgentinaArmeniaAsiaAustraliaAustriaBahamasBangladeshBarbadosBelarusBelgiumBelizeBoliviaBosnia and HerzegovinaBrazilBulgariaBurma/MyanmarCabo VerdeCambodiaCameroonCanadaCaribbeanCentral AmericaChileChinaColombiaCongoCosta RicaCroatiaCubaCzechoslovakiaDenmarkDominicaDominican RepublicEastern AfricaEastern AsiaEastern EuropeEcuadorEgyptEl SalvadorEnglandEritreaEthiopiaEuropeFijiFranceGermanyGhanaGreeceGrenadaGuatemalaGuyanaHaitiHondurasHong KongHungaryIndiaIndonesiaIranIraqIrelandIsraelItalyJamaicaJapanJordanKazakhstanKenyaKoreaKuwaitLaosLatin AmericaLatviaLebanonLiberiaLithuaniaMalaysiaMexicoMicronesiaMiddle AfricaMoldovaMoroccoNepalNetherlandsNigeriaNorth AmericaNorth MacedoniaNorthern AfricaNorthern EuropeNorwayOceaniaPakistanPanamaPeruPhilippinesPolandPortugalRomaniaRussiaSaudi ArabiaScotlandSenegalSerbiaSierra LeoneSingaporeSomaliaSouth AfricaSouth AmericaSouth Central AsiaSouth Eastern AsiaSouthern EuropeSpainSri LankaSt. Vincent and the GrenadinesSudanSwedenSwitzerlandSyriaTaiwanThailandTrinidad and TobagoTurkeyUgandaUkraineUruguayUzbekistanVenezuelaVietnamWest IndiesWestern AfricaWestern AsiaWestern EuropeYemenZaireZimbabweAzores
Immigrants from Nicaragua
Race
Ancestry
AfghanAfricanAlaska NativeAlaskan AthabascanAlbanianAleutAlsatianAmericanApacheArabArapahoArgentineanArmenianAssyrian/Chaldean/SyriacAustralianAustrianBahamianBangladeshiBarbadianBasqueBelgianBelizeanBermudanBhutaneseBlackfeetBolivianBrazilianBritishBritish West IndianBulgarianBurmeseCajunCambodianCanadianCape VerdeanCarpatho RusynCelticCentral AmericanCentral American IndianCherokeeCheyenneChickasawChileanChineseChippewaChoctawColombianColvilleComancheCosta RicanCreeCreekCroatianCrowCubanCypriotCzechCzechoslovakianDanishDelawareDominicanDutchDutch West IndianEastern EuropeanEcuadorianEnglishEstonianEthiopianEuropeanFijianFilipinoFinnishFrenchFrench American IndianFrench CanadianGermanGerman RussianGhanaianGreekGuamanian/ChamorroGuatemalanGuyaneseHaitianHmongHonduranHopiHoumaHungarianIcelanderIndian (Asian)IndonesianInupiatIranianIraqiIrishIroquoisIsraeliItalianJamaicanJapaneseJordanianKenyanKiowaKoreanLaotianLatvianLebaneseLiberianLithuanianLumbeeLuxembourgerMacedonianMalaysianMalteseMarshalleseMenomineeMexicanMexican American IndianMongolianMoroccanNative HawaiianNavajoNepaleseNew ZealanderNicaraguanNigerianNorthern EuropeanNorwegianOkinawanOsageOttawaPaiutePakistaniPalestinianPanamanianParaguayanPennsylvania GermanPeruvianPimaPolishPortuguesePotawatomiPuebloPuerto RicanPuget Sound SalishRomanianRussianSalvadoranSamoanScandinavianScotch-IrishScottishSeminoleSenegaleseSerbianShoshoneSierra LeoneanSiouxSlavicSlovakSloveneSomaliSouth AfricanSouth AmericanSouth American IndianSoviet UnionSpaniardSpanishSpanish AmericanSpanish American IndianSri LankanSubsaharan AfricanSudaneseSwedishSwissSyrianTaiwaneseThaiTlingit-HaidaTohono O'OdhamTonganTrinidadian and TobagonianTsimshianTurkishU.S. Virgin IslanderUgandanUkrainianUruguayanUteVenezuelanVietnameseWelshWest IndianYakamaYaquiYugoslavianYumanYup'ikZimbabwean
Immigration
NonimmigrantsImmigrantsAfghanistanAfricaAlbaniaArgentinaArmeniaAsiaAustraliaAustriaBahamasBangladeshBarbadosBelarusBelgiumBelizeBoliviaBosnia and HerzegovinaBrazilBulgariaBurma/MyanmarCabo VerdeCambodiaCameroonCanadaCaribbeanCentral AmericaChileChinaColombiaCongoCosta RicaCroatiaCubaCzechoslovakiaDenmarkDominicaDominican RepublicEastern AfricaEastern AsiaEastern EuropeEcuadorEgyptEl SalvadorEnglandEritreaEthiopiaEuropeFijiFranceGermanyGhanaGreeceGrenadaGuatemalaGuyanaHaitiHondurasHong KongHungaryIndiaIndonesiaIranIraqIrelandIsraelItalyJamaicaJapanJordanKazakhstanKenyaKoreaKuwaitLaosLatin AmericaLatviaLebanonLiberiaLithuaniaMalaysiaMexicoMicronesiaMiddle AfricaMoldovaMoroccoNepalNetherlandsNicaraguaNigeriaNorth AmericaNorth MacedoniaNorthern AfricaNorthern EuropeNorwayOceaniaPakistanPanamaPeruPhilippinesPolandPortugalRomaniaRussiaSaudi ArabiaScotlandSenegalSerbiaSierra LeoneSingaporeSomaliaSouth AfricaSouth AmericaSouth Central AsiaSouth Eastern AsiaSouthern EuropeSpainSri LankaSt. Vincent and the GrenadinesSudanSwedenSwitzerlandSyriaTaiwanThailandTrinidad and TobagoTurkeyUgandaUkraineUruguayUzbekistanVenezuelaVietnamWest IndiesWestern AfricaWestern AsiaWestern EuropeYemenZaireZimbabweAzores
Master's Degree
Income
Poverty
Unemployment
Labor Participation
Family Structure
Vehicle Availability
Education Level
Disability

Master's Degree Comparison

Egyptians

Immigrants from Nicaragua

Exceptional
Tragic
17.6%
MASTER'S DEGREE
99.6/ 100
METRIC RATING
75th/ 347
METRIC RANK
11.8%
MASTER'S DEGREE
0.2/ 100
METRIC RATING
285th/ 347
METRIC RANK

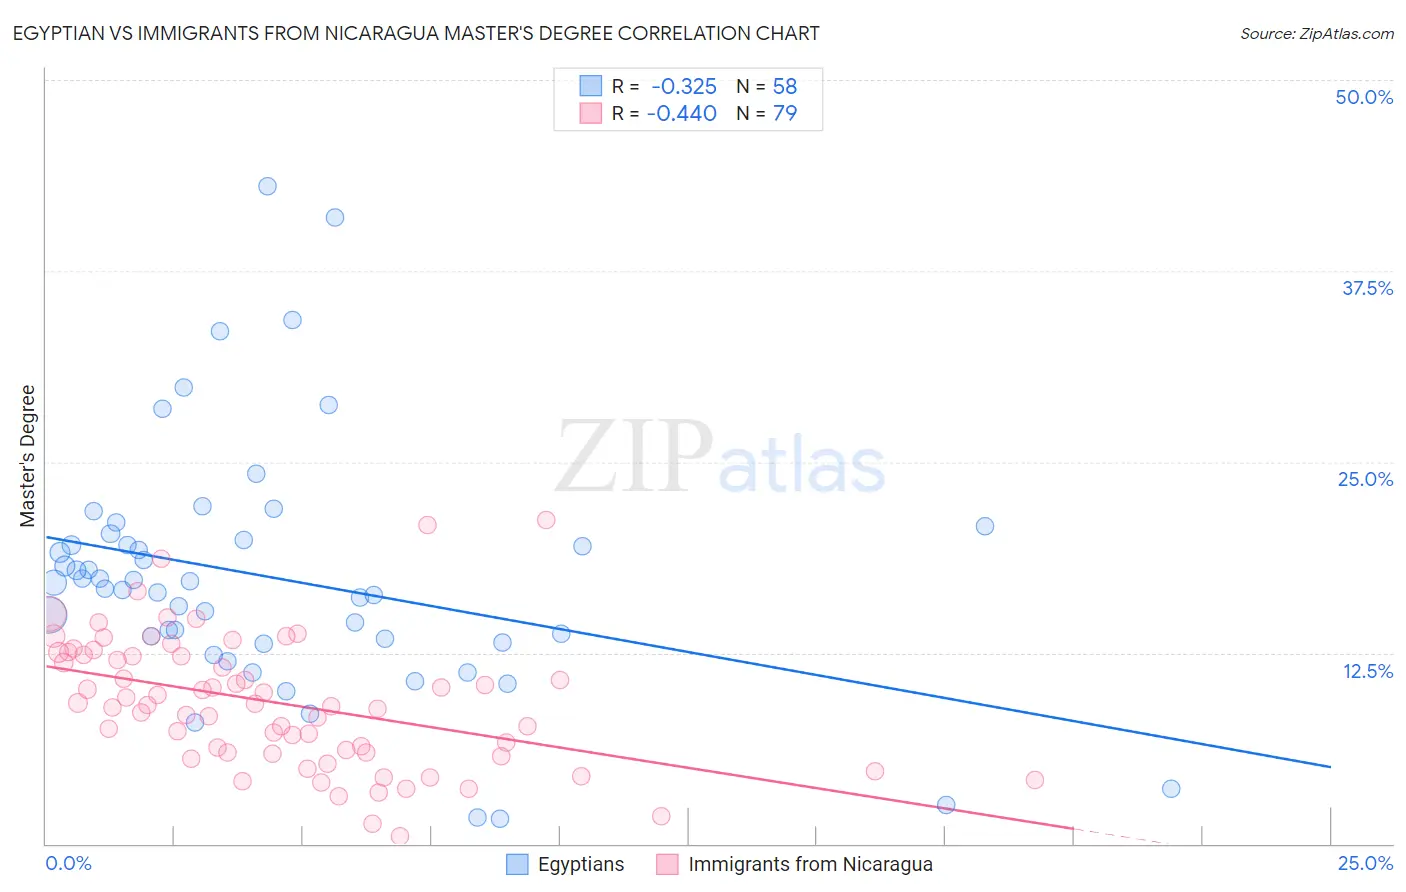
Egyptian vs Immigrants from Nicaragua Master's Degree Correlation Chart

The statistical analysis conducted on geographies consisting of 276,863,578 people shows a mild negative correlation between the proportion of Egyptians and percentage of population with at least master's degree education in the United States with a correlation coefficient (R) of -0.325 and weighted average of 17.6%. Similarly, the statistical analysis conducted on geographies consisting of 236,327,248 people shows a moderate negative correlation between the proportion of Immigrants from Nicaragua and percentage of population with at least master's degree education in the United States with a correlation coefficient (R) of -0.440 and weighted average of 11.8%, a difference of 48.6%.
Egyptian vs Immigrants from Nicaragua Master's Degree

Master's Degree Correlation Summary

MeasurementEgyptianImmigrants from Nicaragua
Minimum1.6%0.53%
Maximum43.1%21.2%
Range41.4%20.7%
Mean17.4%9.2%
Median16.9%9.1%
Interquartile 25% (IQ1)13.2%6.0%
Interquartile 75% (IQ3)19.9%12.4%
Interquartile Range (IQR)6.7%6.4%
Standard Deviation (Sample)8.2%4.3%
Standard Deviation (Population)8.1%4.3%

Similar Demographics by Master's Degree

Demographics Similar to Egyptians by Master's Degree

In terms of master's degree, the demographic groups most similar to Egyptians are Immigrants from Indonesia (17.6%, a difference of 0.030%), Immigrants from Eastern Europe (17.6%, a difference of 0.14%), Immigrants from Hungary (17.5%, a difference of 0.34%), Immigrants from Romania (17.7%, a difference of 0.38%), and Immigrants from Lebanon (17.5%, a difference of 0.47%).
DemographicsRating | RankMaster's Degree
Immigrants | Ethiopia
99.8
/100
|
#68
Exceptional
17.9%
Immigrants | Uzbekistan
99.8
/100
|
#69
Exceptional
17.9%
Immigrants | Western Europe
99.8
/100
|
#70
Exceptional
17.8%
Immigrants | Pakistan
99.7
/100
|
#71
Exceptional
17.8%
Lithuanians
99.7
/100
|
#72
Exceptional
17.7%
Zimbabweans
99.7
/100
|
#73
Exceptional
17.7%
Immigrants | Romania
99.7
/100
|
#74
Exceptional
17.7%
Egyptians
99.6
/100
|
#75
Exceptional
17.6%
Immigrants | Indonesia
99.6
/100
|
#76
Exceptional
17.6%
Immigrants | Eastern Europe
99.6
/100
|
#77
Exceptional
17.6%
Immigrants | Hungary
99.6
/100
|
#78
Exceptional
17.5%
Immigrants | Lebanon
99.6
/100
|
#79
Exceptional
17.5%
Carpatho Rusyns
99.6
/100
|
#80
Exceptional
17.5%
Immigrants | Western Asia
99.5
/100
|
#81
Exceptional
17.5%
Greeks
99.5
/100
|
#82
Exceptional
17.5%

Demographics Similar to Immigrants from Nicaragua by Master's Degree

In terms of master's degree, the demographic groups most similar to Immigrants from Nicaragua are Ottawa (11.9%, a difference of 0.18%), Aleut (11.8%, a difference of 0.35%), Immigrants from Haiti (11.8%, a difference of 0.55%), Immigrants from Honduras (11.8%, a difference of 0.72%), and Guatemalan (11.7%, a difference of 0.80%).
DemographicsRating | RankMaster's Degree
Potawatomi
0.3
/100
|
#278
Tragic
12.1%
Immigrants | Belize
0.2
/100
|
#279
Tragic
12.1%
Immigrants | Dominican Republic
0.2
/100
|
#280
Tragic
12.1%
Malaysians
0.2
/100
|
#281
Tragic
12.0%
Immigrants | El Salvador
0.2
/100
|
#282
Tragic
12.0%
Hondurans
0.2
/100
|
#283
Tragic
11.9%
Ottawa
0.2
/100
|
#284
Tragic
11.9%
Immigrants | Nicaragua
0.2
/100
|
#285
Tragic
11.8%
Aleuts
0.1
/100
|
#286
Tragic
11.8%
Immigrants | Haiti
0.1
/100
|
#287
Tragic
11.8%
Immigrants | Honduras
0.1
/100
|
#288
Tragic
11.8%
Guatemalans
0.1
/100
|
#289
Tragic
11.7%
Ute
0.1
/100
|
#290
Tragic
11.7%
Colville
0.1
/100
|
#291
Tragic
11.6%
Immigrants | Guatemala
0.1
/100
|
#292
Tragic
11.6%