Pakistani vs Immigrants from Western Europe Doctorate Degree
COMPARE
Pakistani
Immigrants from Western Europe
Doctorate Degree
Doctorate Degree Comparison
Pakistanis
Immigrants from Western Europe
2.0%
DOCTORATE DEGREE
95.8/ 100
METRIC RATING
119th/ 347
METRIC RANK
2.4%
DOCTORATE DEGREE
100.0/ 100
METRIC RATING
47th/ 347
METRIC RANK
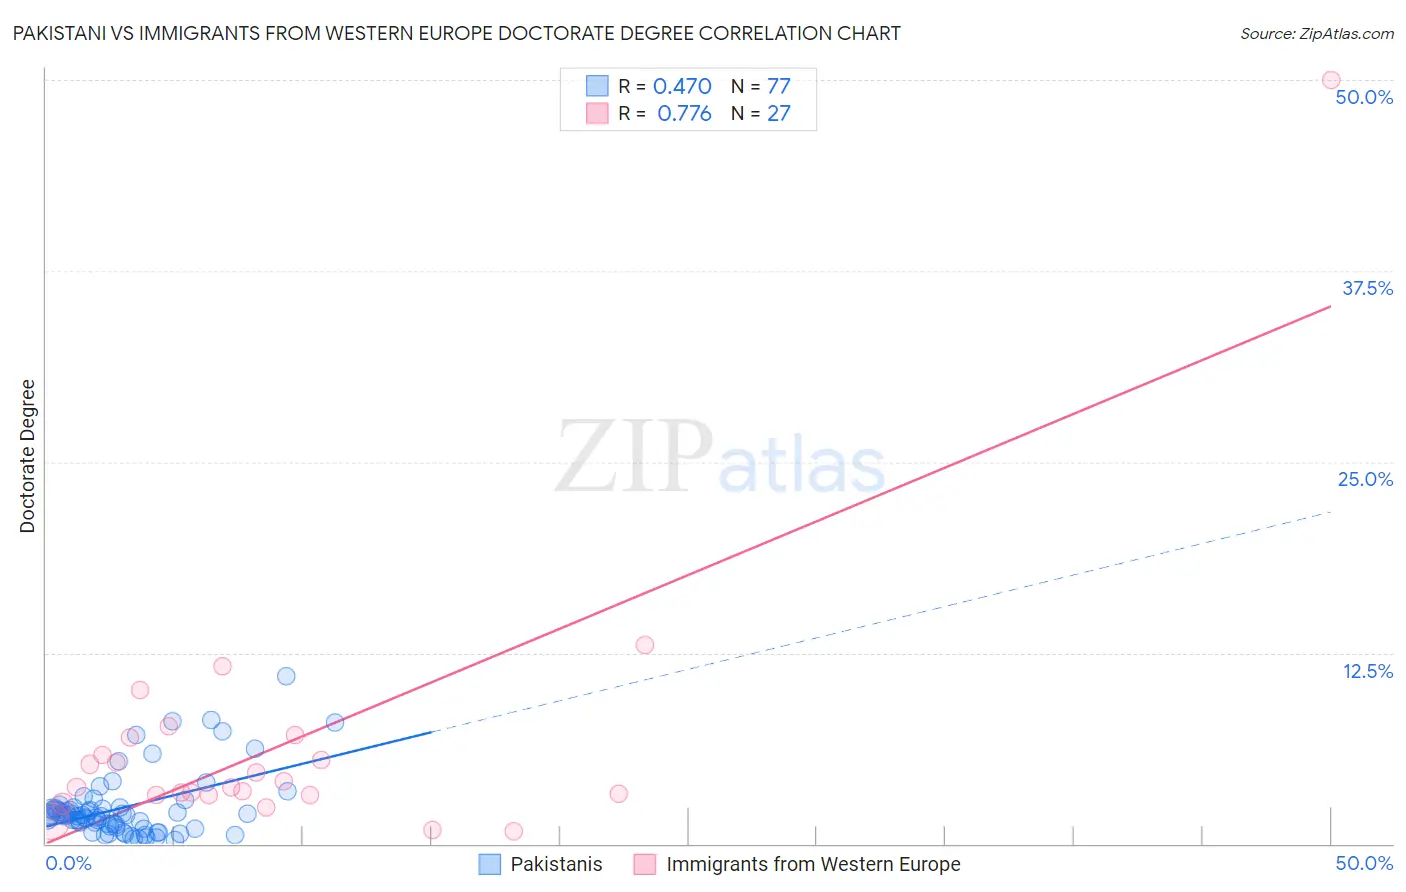
Pakistani vs Immigrants from Western Europe Doctorate Degree Correlation Chart
The statistical analysis conducted on geographies consisting of 333,015,067 people shows a moderate positive correlation between the proportion of Pakistanis and percentage of population with at least doctorate degree education in the United States with a correlation coefficient (R) of 0.470 and weighted average of 2.0%. Similarly, the statistical analysis conducted on geographies consisting of 485,772,284 people shows a strong positive correlation between the proportion of Immigrants from Western Europe and percentage of population with at least doctorate degree education in the United States with a correlation coefficient (R) of 0.776 and weighted average of 2.4%, a difference of 18.8%.
Doctorate Degree Correlation Summary
| Measurement | Pakistani | Immigrants from Western Europe |
| Minimum | 0.22% | 0.81% |
| Maximum | 11.0% | 50.0% |
| Range | 10.8% | 49.2% |
| Mean | 2.4% | 6.5% |
| Median | 1.9% | 3.7% |
| Interquartile 25% (IQ1) | 1.1% | 3.2% |
| Interquartile 75% (IQ3) | 2.4% | 7.0% |
| Interquartile Range (IQR) | 1.3% | 3.8% |
| Standard Deviation (Sample) | 2.1% | 9.2% |
| Standard Deviation (Population) | 2.1% | 9.0% |
Similar Demographics by Doctorate Degree
Demographics Similar to Pakistanis by Doctorate Degree
In terms of doctorate degree, the demographic groups most similar to Pakistanis are Icelander (2.1%, a difference of 0.13%), Lebanese (2.1%, a difference of 0.17%), Immigrants from Morocco (2.0%, a difference of 0.28%), Maltese (2.1%, a difference of 0.34%), and Immigrants from Jordan (2.0%, a difference of 0.76%).
| Demographics | Rating | Rank | Doctorate Degree |
| Syrians | 97.1 /100 | #112 | Exceptional 2.1% |
| Immigrants | Italy | 96.9 /100 | #113 | Exceptional 2.1% |
| Immigrants | Croatia | 96.8 /100 | #114 | Exceptional 2.1% |
| Taiwanese | 96.7 /100 | #115 | Exceptional 2.1% |
| Maltese | 96.2 /100 | #116 | Exceptional 2.1% |
| Lebanese | 96.0 /100 | #117 | Exceptional 2.1% |
| Icelanders | 96.0 /100 | #118 | Exceptional 2.1% |
| Pakistanis | 95.8 /100 | #119 | Exceptional 2.0% |
| Immigrants | Morocco | 95.5 /100 | #120 | Exceptional 2.0% |
| Immigrants | Jordan | 94.8 /100 | #121 | Exceptional 2.0% |
| Immigrants | Southern Europe | 94.7 /100 | #122 | Exceptional 2.0% |
| Croatians | 94.0 /100 | #123 | Exceptional 2.0% |
| Ute | 93.2 /100 | #124 | Exceptional 2.0% |
| Moroccans | 93.0 /100 | #125 | Exceptional 2.0% |
| Jordanians | 92.1 /100 | #126 | Exceptional 2.0% |
Demographics Similar to Immigrants from Western Europe by Doctorate Degree
In terms of doctorate degree, the demographic groups most similar to Immigrants from Western Europe are Asian (2.4%, a difference of 0.21%), Immigrants from Austria (2.4%, a difference of 0.22%), Immigrants from Asia (2.4%, a difference of 0.34%), Immigrants from South Africa (2.4%, a difference of 0.36%), and Immigrants from Norway (2.4%, a difference of 1.5%).
| Demographics | Rating | Rank | Doctorate Degree |
| Estonians | 100.0 /100 | #40 | Exceptional 2.5% |
| Immigrants | Russia | 100.0 /100 | #41 | Exceptional 2.5% |
| New Zealanders | 100.0 /100 | #42 | Exceptional 2.5% |
| Soviet Union | 100.0 /100 | #43 | Exceptional 2.5% |
| Immigrants | Netherlands | 100.0 /100 | #44 | Exceptional 2.5% |
| Immigrants | South Africa | 100.0 /100 | #45 | Exceptional 2.4% |
| Immigrants | Austria | 100.0 /100 | #46 | Exceptional 2.4% |
| Immigrants | Western Europe | 100.0 /100 | #47 | Exceptional 2.4% |
| Asians | 100.0 /100 | #48 | Exceptional 2.4% |
| Immigrants | Asia | 100.0 /100 | #49 | Exceptional 2.4% |
| Immigrants | Norway | 100.0 /100 | #50 | Exceptional 2.4% |
| Australians | 100.0 /100 | #51 | Exceptional 2.4% |
| Bulgarians | 100.0 /100 | #52 | Exceptional 2.4% |
| Immigrants | Latvia | 100.0 /100 | #53 | Exceptional 2.4% |
| Immigrants | Indonesia | 100.0 /100 | #54 | Exceptional 2.4% |