Pennsylvania German vs Arab Doctorate Degree
COMPARE
Pennsylvania German
Arab
Doctorate Degree
Doctorate Degree Comparison
Pennsylvania Germans
Arabs
1.4%
DOCTORATE DEGREE
0.1/ 100
METRIC RATING
305th/ 347
METRIC RANK
2.1%
DOCTORATE DEGREE
97.8/ 100
METRIC RATING
105th/ 347
METRIC RANK
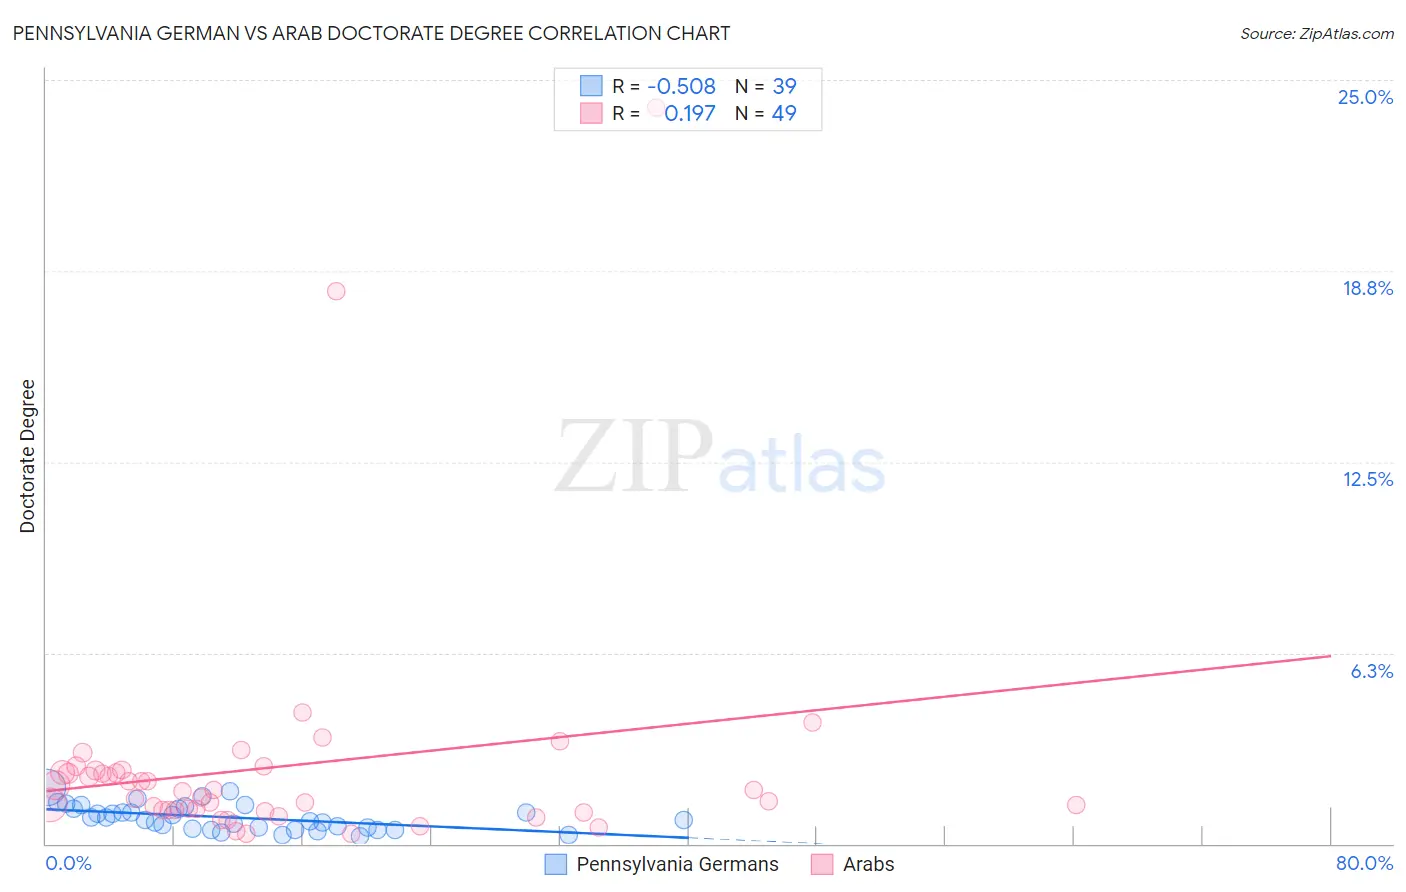
Pennsylvania German vs Arab Doctorate Degree Correlation Chart
The statistical analysis conducted on geographies consisting of 230,381,688 people shows a substantial negative correlation between the proportion of Pennsylvania Germans and percentage of population with at least doctorate degree education in the United States with a correlation coefficient (R) of -0.508 and weighted average of 1.4%. Similarly, the statistical analysis conducted on geographies consisting of 479,921,881 people shows a poor positive correlation between the proportion of Arabs and percentage of population with at least doctorate degree education in the United States with a correlation coefficient (R) of 0.197 and weighted average of 2.1%, a difference of 51.7%.
Doctorate Degree Correlation Summary
| Measurement | Pennsylvania German | Arab |
| Minimum | 0.24% | 0.33% |
| Maximum | 1.8% | 24.1% |
| Range | 1.6% | 23.8% |
| Mean | 0.86% | 2.5% |
| Median | 0.80% | 1.7% |
| Interquartile 25% (IQ1) | 0.48% | 1.1% |
| Interquartile 75% (IQ3) | 1.1% | 2.4% |
| Interquartile Range (IQR) | 0.65% | 1.3% |
| Standard Deviation (Sample) | 0.41% | 4.0% |
| Standard Deviation (Population) | 0.41% | 4.0% |
Similar Demographics by Doctorate Degree
Demographics Similar to Pennsylvania Germans by Doctorate Degree
In terms of doctorate degree, the demographic groups most similar to Pennsylvania Germans are Guyanese (1.4%, a difference of 0.010%), Mexican American Indian (1.4%, a difference of 0.13%), Immigrants from Dominica (1.4%, a difference of 0.19%), Shoshone (1.4%, a difference of 0.22%), and Cuban (1.4%, a difference of 0.26%).
| Demographics | Rating | Rank | Doctorate Degree |
| Puerto Ricans | 0.1 /100 | #298 | Tragic 1.4% |
| Belizeans | 0.1 /100 | #299 | Tragic 1.4% |
| Immigrants | Guatemala | 0.1 /100 | #300 | Tragic 1.4% |
| Hondurans | 0.1 /100 | #301 | Tragic 1.4% |
| Shoshone | 0.1 /100 | #302 | Tragic 1.4% |
| Immigrants | Dominica | 0.1 /100 | #303 | Tragic 1.4% |
| Mexican American Indians | 0.1 /100 | #304 | Tragic 1.4% |
| Pennsylvania Germans | 0.1 /100 | #305 | Tragic 1.4% |
| Guyanese | 0.1 /100 | #306 | Tragic 1.4% |
| Cubans | 0.1 /100 | #307 | Tragic 1.4% |
| Immigrants | Laos | 0.1 /100 | #308 | Tragic 1.4% |
| Immigrants | Grenada | 0.1 /100 | #309 | Tragic 1.4% |
| Immigrants | Jamaica | 0.1 /100 | #310 | Tragic 1.4% |
| Immigrants | Honduras | 0.1 /100 | #311 | Tragic 1.4% |
| Immigrants | Nicaragua | 0.1 /100 | #312 | Tragic 1.4% |
Demographics Similar to Arabs by Doctorate Degree
In terms of doctorate degree, the demographic groups most similar to Arabs are Sudanese (2.1%, a difference of 0.10%), Austrian (2.1%, a difference of 0.35%), Romanian (2.1%, a difference of 0.47%), Immigrants from Chile (2.1%, a difference of 0.48%), and European (2.1%, a difference of 0.49%).
| Demographics | Rating | Rank | Doctorate Degree |
| Armenians | 98.3 /100 | #98 | Exceptional 2.1% |
| Immigrants | Egypt | 98.2 /100 | #99 | Exceptional 2.1% |
| Immigrants | Eastern Europe | 98.2 /100 | #100 | Exceptional 2.1% |
| Immigrants | Eastern Africa | 98.2 /100 | #101 | Exceptional 2.1% |
| Immigrants | Chile | 98.1 /100 | #102 | Exceptional 2.1% |
| Romanians | 98.1 /100 | #103 | Exceptional 2.1% |
| Austrians | 98.0 /100 | #104 | Exceptional 2.1% |
| Arabs | 97.8 /100 | #105 | Exceptional 2.1% |
| Sudanese | 97.7 /100 | #106 | Exceptional 2.1% |
| Europeans | 97.5 /100 | #107 | Exceptional 2.1% |
| Immigrants | Germany | 97.3 /100 | #108 | Exceptional 2.1% |
| Ukrainians | 97.2 /100 | #109 | Exceptional 2.1% |
| Brazilians | 97.2 /100 | #110 | Exceptional 2.1% |
| Immigrants | Pakistan | 97.1 /100 | #111 | Exceptional 2.1% |
| Syrians | 97.1 /100 | #112 | Exceptional 2.1% |