Pakistani vs Immigrants from Grenada Doctorate Degree
COMPARE
Pakistani
Immigrants from Grenada
Doctorate Degree
Doctorate Degree Comparison
Pakistanis
Immigrants from Grenada
2.0%
DOCTORATE DEGREE
95.8/ 100
METRIC RATING
119th/ 347
METRIC RANK
1.4%
DOCTORATE DEGREE
0.1/ 100
METRIC RATING
309th/ 347
METRIC RANK
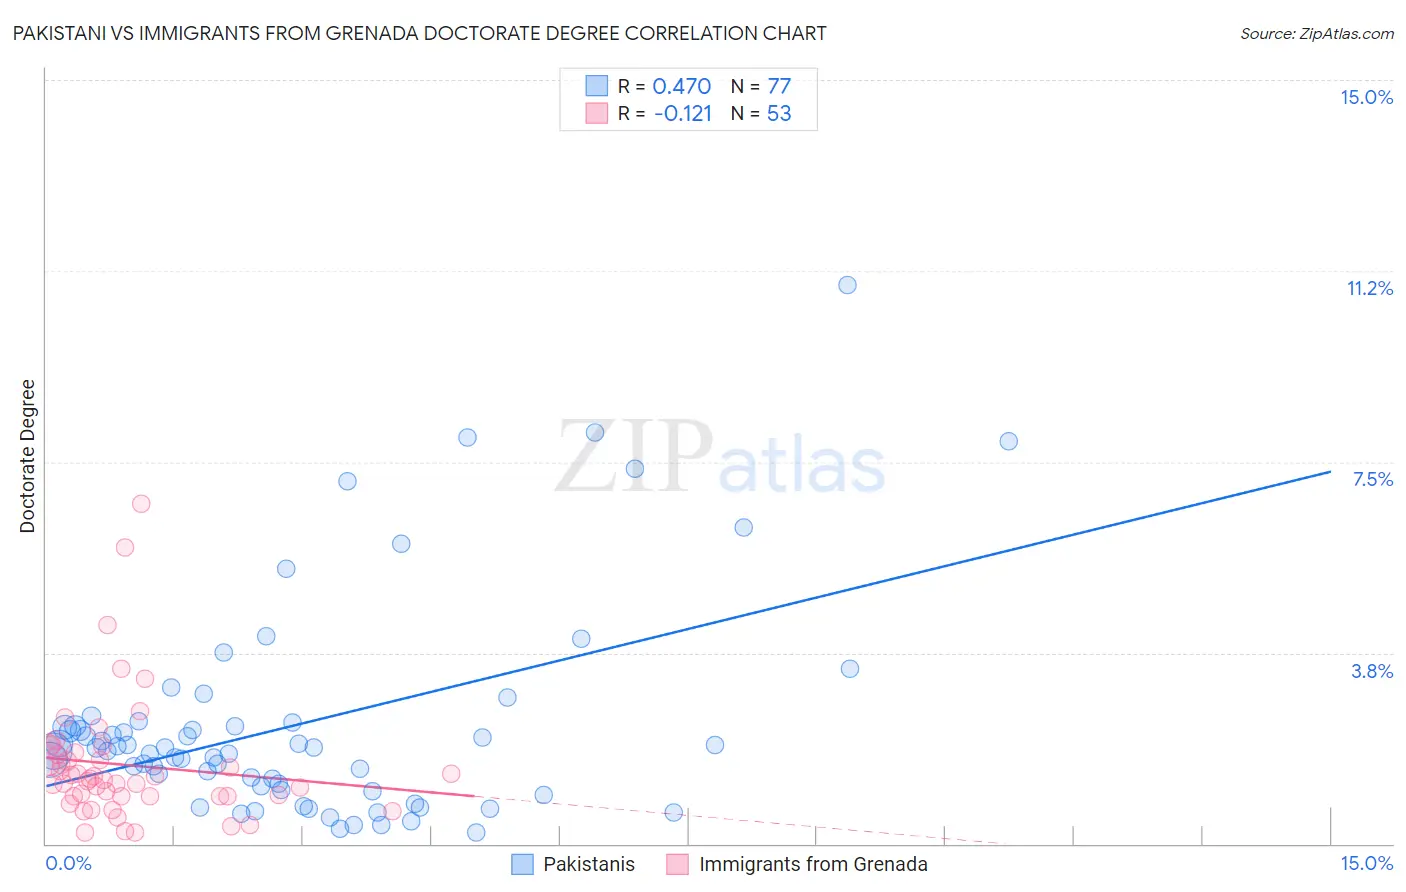
Pakistani vs Immigrants from Grenada Doctorate Degree Correlation Chart
The statistical analysis conducted on geographies consisting of 333,015,067 people shows a moderate positive correlation between the proportion of Pakistanis and percentage of population with at least doctorate degree education in the United States with a correlation coefficient (R) of 0.470 and weighted average of 2.0%. Similarly, the statistical analysis conducted on geographies consisting of 67,051,362 people shows a poor negative correlation between the proportion of Immigrants from Grenada and percentage of population with at least doctorate degree education in the United States with a correlation coefficient (R) of -0.121 and weighted average of 1.4%, a difference of 49.6%.
Doctorate Degree Correlation Summary
| Measurement | Pakistani | Immigrants from Grenada |
| Minimum | 0.22% | 0.22% |
| Maximum | 11.0% | 6.7% |
| Range | 10.8% | 6.4% |
| Mean | 2.4% | 1.5% |
| Median | 1.9% | 1.3% |
| Interquartile 25% (IQ1) | 1.1% | 0.93% |
| Interquartile 75% (IQ3) | 2.4% | 1.8% |
| Interquartile Range (IQR) | 1.3% | 0.83% |
| Standard Deviation (Sample) | 2.1% | 1.2% |
| Standard Deviation (Population) | 2.1% | 1.2% |
Similar Demographics by Doctorate Degree
Demographics Similar to Pakistanis by Doctorate Degree
In terms of doctorate degree, the demographic groups most similar to Pakistanis are Icelander (2.1%, a difference of 0.13%), Lebanese (2.1%, a difference of 0.17%), Immigrants from Morocco (2.0%, a difference of 0.28%), Maltese (2.1%, a difference of 0.34%), and Immigrants from Jordan (2.0%, a difference of 0.76%).
| Demographics | Rating | Rank | Doctorate Degree |
| Syrians | 97.1 /100 | #112 | Exceptional 2.1% |
| Immigrants | Italy | 96.9 /100 | #113 | Exceptional 2.1% |
| Immigrants | Croatia | 96.8 /100 | #114 | Exceptional 2.1% |
| Taiwanese | 96.7 /100 | #115 | Exceptional 2.1% |
| Maltese | 96.2 /100 | #116 | Exceptional 2.1% |
| Lebanese | 96.0 /100 | #117 | Exceptional 2.1% |
| Icelanders | 96.0 /100 | #118 | Exceptional 2.1% |
| Pakistanis | 95.8 /100 | #119 | Exceptional 2.0% |
| Immigrants | Morocco | 95.5 /100 | #120 | Exceptional 2.0% |
| Immigrants | Jordan | 94.8 /100 | #121 | Exceptional 2.0% |
| Immigrants | Southern Europe | 94.7 /100 | #122 | Exceptional 2.0% |
| Croatians | 94.0 /100 | #123 | Exceptional 2.0% |
| Ute | 93.2 /100 | #124 | Exceptional 2.0% |
| Moroccans | 93.0 /100 | #125 | Exceptional 2.0% |
| Jordanians | 92.1 /100 | #126 | Exceptional 2.0% |
Demographics Similar to Immigrants from Grenada by Doctorate Degree
In terms of doctorate degree, the demographic groups most similar to Immigrants from Grenada are Immigrants from Jamaica (1.4%, a difference of 0.30%), Immigrants from Laos (1.4%, a difference of 0.41%), Cuban (1.4%, a difference of 0.46%), Immigrants from Honduras (1.4%, a difference of 0.47%), and Guyanese (1.4%, a difference of 0.71%).
| Demographics | Rating | Rank | Doctorate Degree |
| Shoshone | 0.1 /100 | #302 | Tragic 1.4% |
| Immigrants | Dominica | 0.1 /100 | #303 | Tragic 1.4% |
| Mexican American Indians | 0.1 /100 | #304 | Tragic 1.4% |
| Pennsylvania Germans | 0.1 /100 | #305 | Tragic 1.4% |
| Guyanese | 0.1 /100 | #306 | Tragic 1.4% |
| Cubans | 0.1 /100 | #307 | Tragic 1.4% |
| Immigrants | Laos | 0.1 /100 | #308 | Tragic 1.4% |
| Immigrants | Grenada | 0.1 /100 | #309 | Tragic 1.4% |
| Immigrants | Jamaica | 0.1 /100 | #310 | Tragic 1.4% |
| Immigrants | Honduras | 0.1 /100 | #311 | Tragic 1.4% |
| Immigrants | Nicaragua | 0.1 /100 | #312 | Tragic 1.4% |
| Menominee | 0.1 /100 | #313 | Tragic 1.4% |
| Dominicans | 0.1 /100 | #314 | Tragic 1.4% |
| Immigrants | Azores | 0.1 /100 | #315 | Tragic 1.4% |
| Navajo | 0.1 /100 | #316 | Tragic 1.4% |