Immigrants from Uruguay vs Arab Doctorate Degree
COMPARE
Immigrants from Uruguay
Arab
Doctorate Degree
Doctorate Degree Comparison
Immigrants from Uruguay
Arabs
1.7%
DOCTORATE DEGREE
9.2/ 100
METRIC RATING
220th/ 347
METRIC RANK
2.1%
DOCTORATE DEGREE
97.8/ 100
METRIC RATING
105th/ 347
METRIC RANK
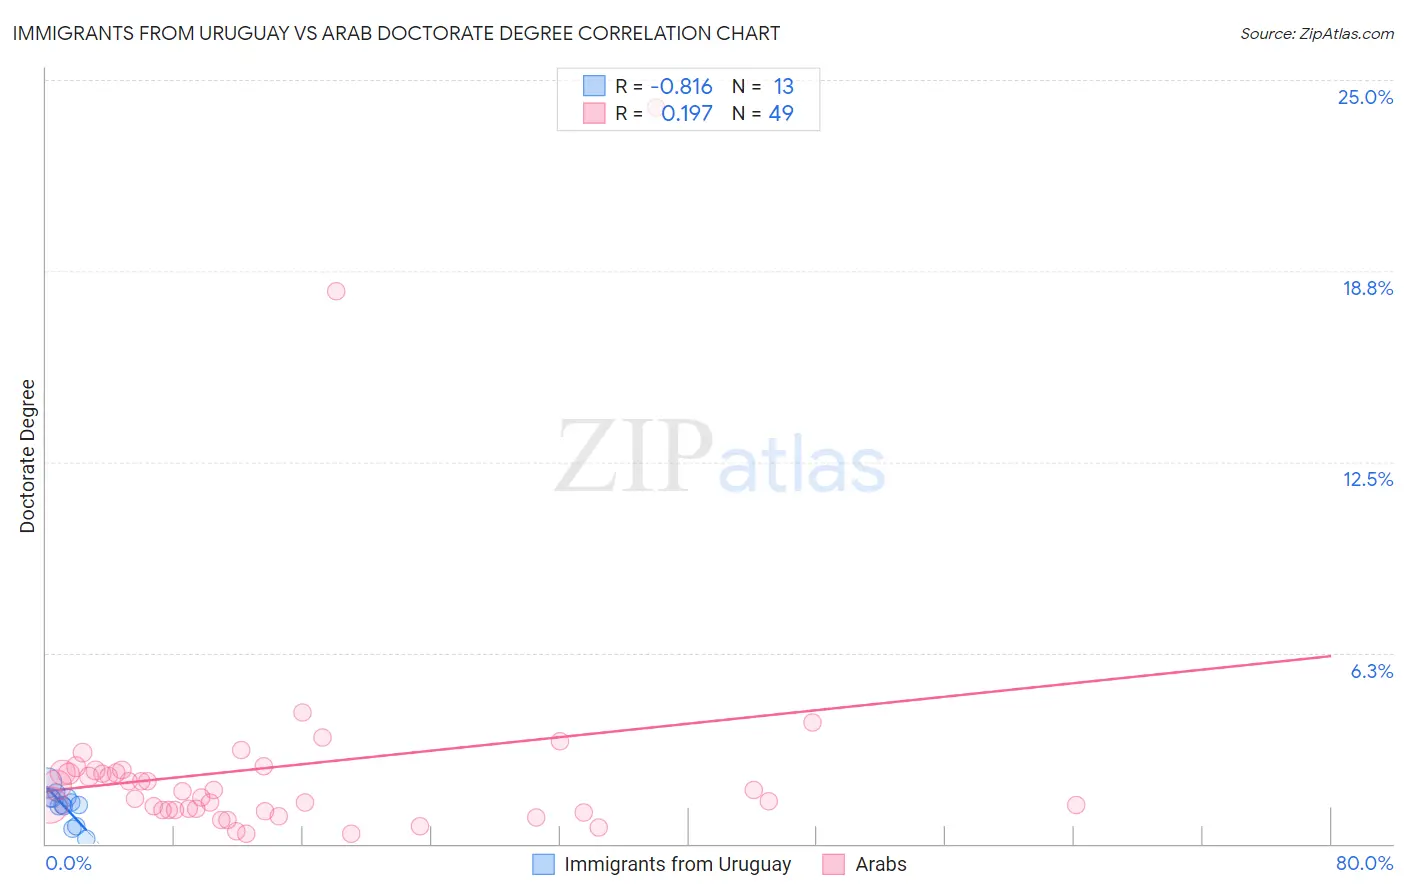
Immigrants from Uruguay vs Arab Doctorate Degree Correlation Chart
The statistical analysis conducted on geographies consisting of 133,064,072 people shows a very strong negative correlation between the proportion of Immigrants from Uruguay and percentage of population with at least doctorate degree education in the United States with a correlation coefficient (R) of -0.816 and weighted average of 1.7%. Similarly, the statistical analysis conducted on geographies consisting of 479,921,881 people shows a poor positive correlation between the proportion of Arabs and percentage of population with at least doctorate degree education in the United States with a correlation coefficient (R) of 0.197 and weighted average of 2.1%, a difference of 24.3%.
Doctorate Degree Correlation Summary
| Measurement | Immigrants from Uruguay | Arab |
| Minimum | 0.18% | 0.33% |
| Maximum | 2.0% | 24.1% |
| Range | 1.8% | 23.8% |
| Mean | 1.2% | 2.5% |
| Median | 1.3% | 1.7% |
| Interquartile 25% (IQ1) | 0.89% | 1.1% |
| Interquartile 75% (IQ3) | 1.5% | 2.4% |
| Interquartile Range (IQR) | 0.62% | 1.3% |
| Standard Deviation (Sample) | 0.51% | 4.0% |
| Standard Deviation (Population) | 0.49% | 4.0% |
Similar Demographics by Doctorate Degree
Demographics Similar to Immigrants from Uruguay by Doctorate Degree
In terms of doctorate degree, the demographic groups most similar to Immigrants from Uruguay are Nonimmigrants (1.7%, a difference of 0.19%), Immigrants from Venezuela (1.7%, a difference of 0.26%), Immigrants from Iraq (1.7%, a difference of 0.66%), Immigrants from Bosnia and Herzegovina (1.7%, a difference of 0.72%), and Immigrants from Poland (1.7%, a difference of 0.94%).
| Demographics | Rating | Rank | Doctorate Degree |
| Koreans | 14.2 /100 | #213 | Poor 1.7% |
| Pueblo | 14.2 /100 | #214 | Poor 1.7% |
| Alaskan Athabascans | 13.8 /100 | #215 | Poor 1.7% |
| Immigrants | Burma/Myanmar | 13.5 /100 | #216 | Poor 1.7% |
| Spanish Americans | 12.9 /100 | #217 | Poor 1.7% |
| Tlingit-Haida | 11.9 /100 | #218 | Poor 1.7% |
| Immigrants | Iraq | 10.7 /100 | #219 | Poor 1.7% |
| Immigrants | Uruguay | 9.2 /100 | #220 | Tragic 1.7% |
| Immigrants | Nonimmigrants | 8.8 /100 | #221 | Tragic 1.7% |
| Immigrants | Venezuela | 8.7 /100 | #222 | Tragic 1.7% |
| Immigrants | Bosnia and Herzegovina | 7.8 /100 | #223 | Tragic 1.7% |
| Immigrants | Poland | 7.4 /100 | #224 | Tragic 1.7% |
| Immigrants | Colombia | 6.7 /100 | #225 | Tragic 1.7% |
| Osage | 6.5 /100 | #226 | Tragic 1.7% |
| Panamanians | 6.3 /100 | #227 | Tragic 1.7% |
Demographics Similar to Arabs by Doctorate Degree
In terms of doctorate degree, the demographic groups most similar to Arabs are Sudanese (2.1%, a difference of 0.10%), Austrian (2.1%, a difference of 0.35%), Romanian (2.1%, a difference of 0.47%), Immigrants from Chile (2.1%, a difference of 0.48%), and European (2.1%, a difference of 0.49%).
| Demographics | Rating | Rank | Doctorate Degree |
| Armenians | 98.3 /100 | #98 | Exceptional 2.1% |
| Immigrants | Egypt | 98.2 /100 | #99 | Exceptional 2.1% |
| Immigrants | Eastern Europe | 98.2 /100 | #100 | Exceptional 2.1% |
| Immigrants | Eastern Africa | 98.2 /100 | #101 | Exceptional 2.1% |
| Immigrants | Chile | 98.1 /100 | #102 | Exceptional 2.1% |
| Romanians | 98.1 /100 | #103 | Exceptional 2.1% |
| Austrians | 98.0 /100 | #104 | Exceptional 2.1% |
| Arabs | 97.8 /100 | #105 | Exceptional 2.1% |
| Sudanese | 97.7 /100 | #106 | Exceptional 2.1% |
| Europeans | 97.5 /100 | #107 | Exceptional 2.1% |
| Immigrants | Germany | 97.3 /100 | #108 | Exceptional 2.1% |
| Ukrainians | 97.2 /100 | #109 | Exceptional 2.1% |
| Brazilians | 97.2 /100 | #110 | Exceptional 2.1% |
| Immigrants | Pakistan | 97.1 /100 | #111 | Exceptional 2.1% |
| Syrians | 97.1 /100 | #112 | Exceptional 2.1% |