Pakistani vs French Doctorate Degree
COMPARE
Pakistani
French
Doctorate Degree
Doctorate Degree Comparison
Pakistanis
French
2.0%
DOCTORATE DEGREE
95.8/ 100
METRIC RATING
119th/ 347
METRIC RANK
1.8%
DOCTORATE DEGREE
48.8/ 100
METRIC RATING
178th/ 347
METRIC RANK
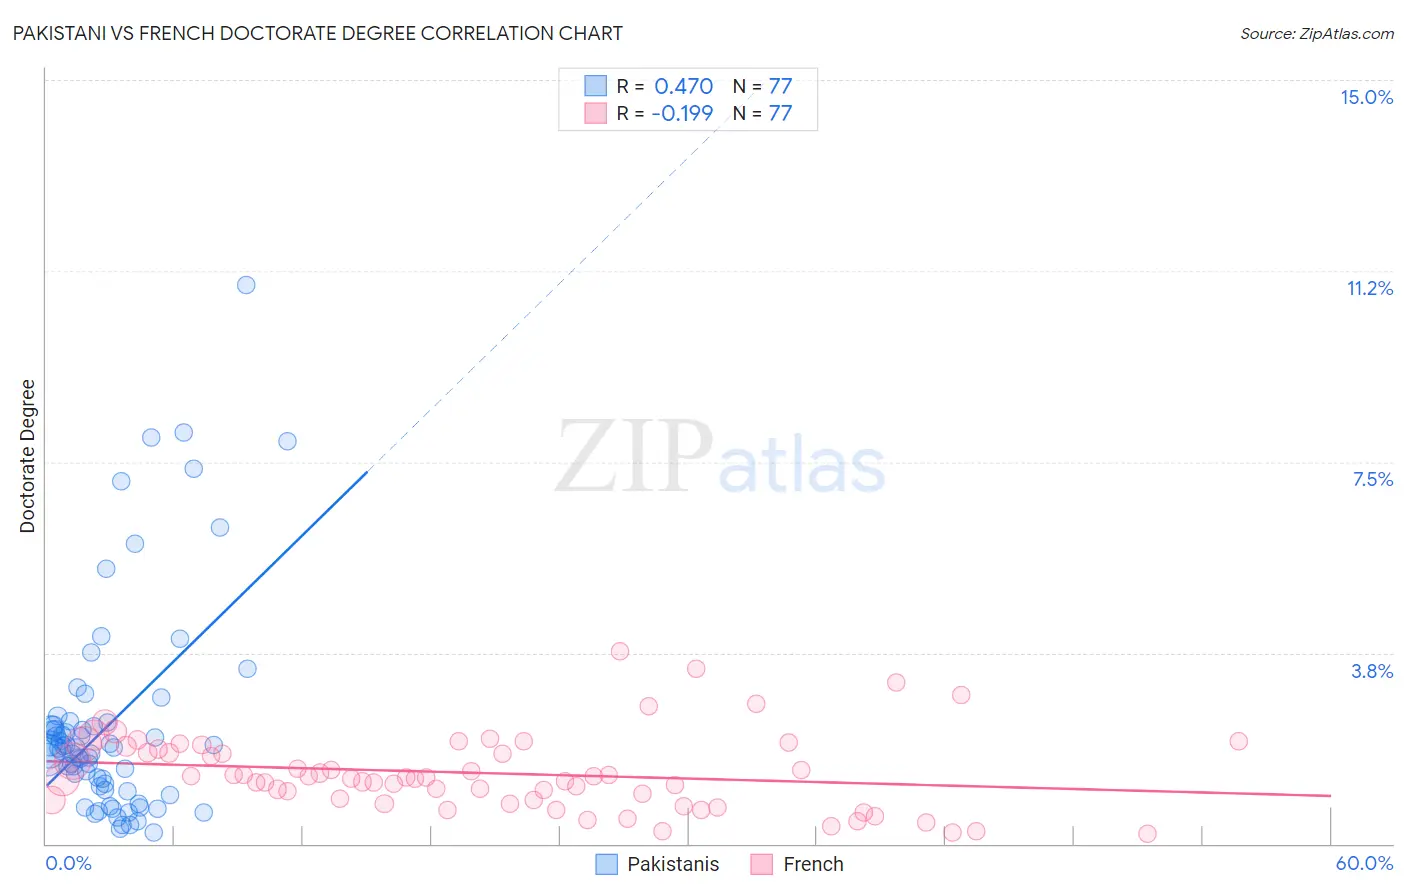
Pakistani vs French Doctorate Degree Correlation Chart
The statistical analysis conducted on geographies consisting of 333,015,067 people shows a moderate positive correlation between the proportion of Pakistanis and percentage of population with at least doctorate degree education in the United States with a correlation coefficient (R) of 0.470 and weighted average of 2.0%. Similarly, the statistical analysis conducted on geographies consisting of 547,467,794 people shows a poor negative correlation between the proportion of French and percentage of population with at least doctorate degree education in the United States with a correlation coefficient (R) of -0.199 and weighted average of 1.8%, a difference of 11.7%.
Doctorate Degree Correlation Summary
| Measurement | Pakistani | French |
| Minimum | 0.22% | 0.20% |
| Maximum | 11.0% | 3.8% |
| Range | 10.8% | 3.6% |
| Mean | 2.4% | 1.4% |
| Median | 1.9% | 1.3% |
| Interquartile 25% (IQ1) | 1.1% | 0.86% |
| Interquartile 75% (IQ3) | 2.4% | 1.9% |
| Interquartile Range (IQR) | 1.3% | 1.0% |
| Standard Deviation (Sample) | 2.1% | 0.75% |
| Standard Deviation (Population) | 2.1% | 0.74% |
Similar Demographics by Doctorate Degree
Demographics Similar to Pakistanis by Doctorate Degree
In terms of doctorate degree, the demographic groups most similar to Pakistanis are Icelander (2.1%, a difference of 0.13%), Lebanese (2.1%, a difference of 0.17%), Immigrants from Morocco (2.0%, a difference of 0.28%), Maltese (2.1%, a difference of 0.34%), and Immigrants from Jordan (2.0%, a difference of 0.76%).
| Demographics | Rating | Rank | Doctorate Degree |
| Syrians | 97.1 /100 | #112 | Exceptional 2.1% |
| Immigrants | Italy | 96.9 /100 | #113 | Exceptional 2.1% |
| Immigrants | Croatia | 96.8 /100 | #114 | Exceptional 2.1% |
| Taiwanese | 96.7 /100 | #115 | Exceptional 2.1% |
| Maltese | 96.2 /100 | #116 | Exceptional 2.1% |
| Lebanese | 96.0 /100 | #117 | Exceptional 2.1% |
| Icelanders | 96.0 /100 | #118 | Exceptional 2.1% |
| Pakistanis | 95.8 /100 | #119 | Exceptional 2.0% |
| Immigrants | Morocco | 95.5 /100 | #120 | Exceptional 2.0% |
| Immigrants | Jordan | 94.8 /100 | #121 | Exceptional 2.0% |
| Immigrants | Southern Europe | 94.7 /100 | #122 | Exceptional 2.0% |
| Croatians | 94.0 /100 | #123 | Exceptional 2.0% |
| Ute | 93.2 /100 | #124 | Exceptional 2.0% |
| Moroccans | 93.0 /100 | #125 | Exceptional 2.0% |
| Jordanians | 92.1 /100 | #126 | Exceptional 2.0% |
Demographics Similar to French by Doctorate Degree
In terms of doctorate degree, the demographic groups most similar to French are Iraqi (1.8%, a difference of 0.060%), Spanish (1.8%, a difference of 0.070%), Ghanaian (1.8%, a difference of 0.070%), Immigrants from Thailand (1.8%, a difference of 0.090%), and Scandinavian (1.8%, a difference of 0.12%).
| Demographics | Rating | Rank | Doctorate Degree |
| Bermudans | 52.1 /100 | #171 | Average 1.8% |
| Belgians | 50.3 /100 | #172 | Average 1.8% |
| Norwegians | 50.0 /100 | #173 | Average 1.8% |
| Immigrants | Bangladesh | 50.0 /100 | #174 | Average 1.8% |
| Immigrants | Thailand | 49.4 /100 | #175 | Average 1.8% |
| Spanish | 49.3 /100 | #176 | Average 1.8% |
| Iraqis | 49.2 /100 | #177 | Average 1.8% |
| French | 48.8 /100 | #178 | Average 1.8% |
| Ghanaians | 48.3 /100 | #179 | Average 1.8% |
| Scandinavians | 48.0 /100 | #180 | Average 1.8% |
| Immigrants | Immigrants | 46.2 /100 | #181 | Average 1.8% |
| Immigrants | Afghanistan | 44.3 /100 | #182 | Average 1.8% |
| Finns | 42.1 /100 | #183 | Average 1.8% |
| Nigerians | 39.9 /100 | #184 | Fair 1.8% |
| Slovaks | 36.4 /100 | #185 | Fair 1.8% |