Paiute vs Immigrants from Cuba Female Unemployment
COMPARE
Paiute
Immigrants from Cuba
Female Unemployment
Female Unemployment Comparison
Paiute
Immigrants from Cuba
6.8%
FEMALE UNEMPLOYMENT
0.0/ 100
METRIC RATING
331st/ 347
METRIC RANK
4.9%
FEMALE UNEMPLOYMENT
99.1/ 100
METRIC RATING
50th/ 347
METRIC RANK
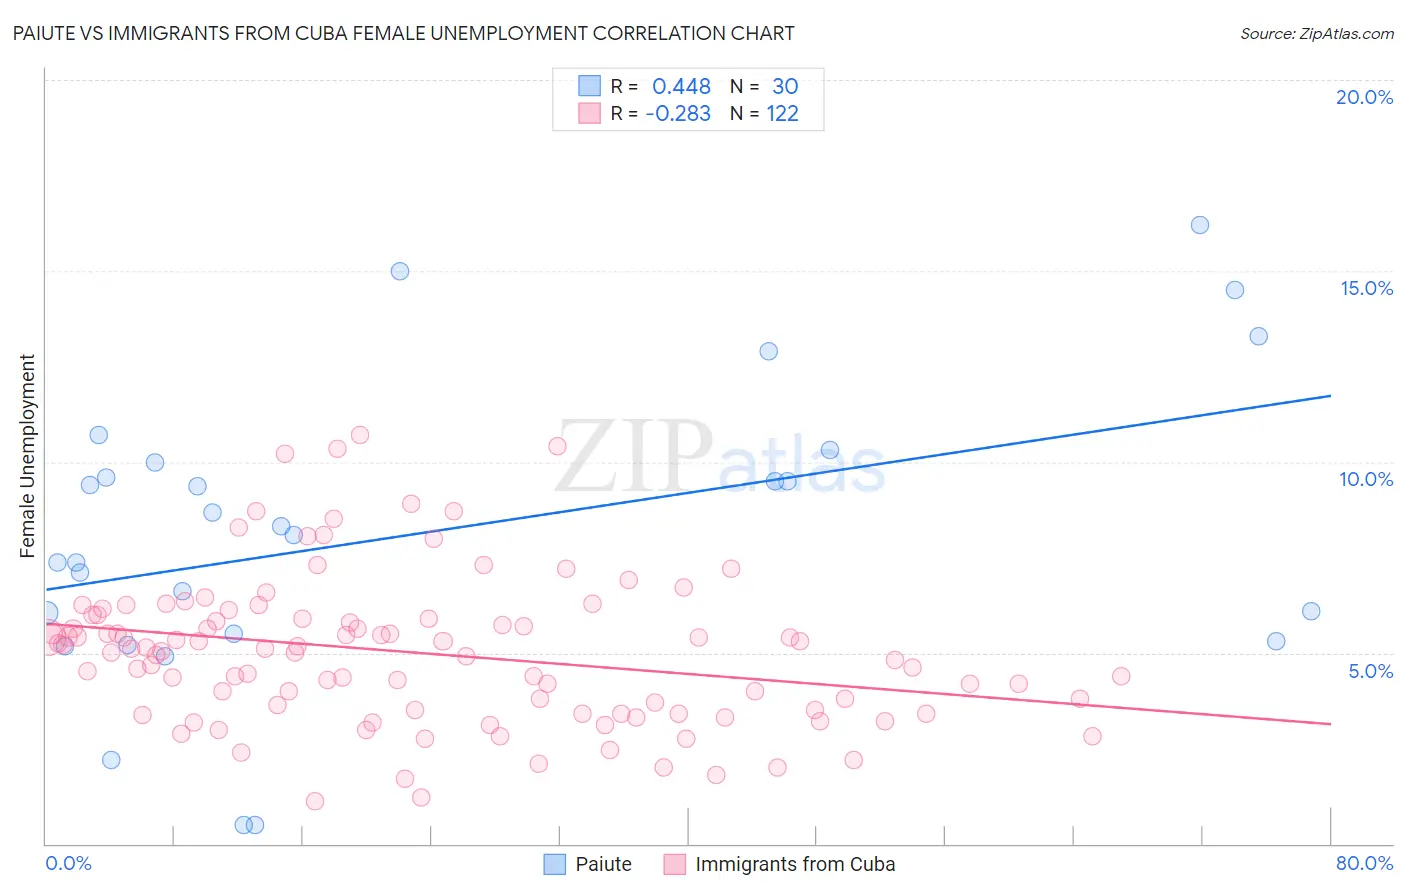
Paiute vs Immigrants from Cuba Female Unemployment Correlation Chart
The statistical analysis conducted on geographies consisting of 58,292,378 people shows a moderate positive correlation between the proportion of Paiute and unemploymnet rate among females in the United States with a correlation coefficient (R) of 0.448 and weighted average of 6.8%. Similarly, the statistical analysis conducted on geographies consisting of 325,054,081 people shows a weak negative correlation between the proportion of Immigrants from Cuba and unemploymnet rate among females in the United States with a correlation coefficient (R) of -0.283 and weighted average of 4.9%, a difference of 39.1%.
Female Unemployment Correlation Summary
| Measurement | Paiute | Immigrants from Cuba |
| Minimum | 0.50% | 1.1% |
| Maximum | 16.2% | 10.7% |
| Range | 15.7% | 9.6% |
| Mean | 8.2% | 5.0% |
| Median | 8.2% | 5.1% |
| Interquartile 25% (IQ1) | 5.5% | 3.5% |
| Interquartile 75% (IQ3) | 10.0% | 5.9% |
| Interquartile Range (IQR) | 4.5% | 2.4% |
| Standard Deviation (Sample) | 3.9% | 1.9% |
| Standard Deviation (Population) | 3.8% | 1.9% |
Similar Demographics by Female Unemployment
Demographics Similar to Paiute by Female Unemployment
In terms of female unemployment, the demographic groups most similar to Paiute are Yakama (6.7%, a difference of 1.1%), Immigrants from Guyana (6.7%, a difference of 1.7%), Guyanese (6.7%, a difference of 2.1%), Alaska Native (6.6%, a difference of 2.5%), and Native/Alaskan (6.6%, a difference of 2.6%).
| Demographics | Rating | Rank | Female Unemployment |
| Cheyenne | 0.0 /100 | #324 | Tragic 6.6% |
| Apache | 0.0 /100 | #325 | Tragic 6.6% |
| Natives/Alaskans | 0.0 /100 | #326 | Tragic 6.6% |
| Alaska Natives | 0.0 /100 | #327 | Tragic 6.6% |
| Guyanese | 0.0 /100 | #328 | Tragic 6.7% |
| Immigrants | Guyana | 0.0 /100 | #329 | Tragic 6.7% |
| Yakama | 0.0 /100 | #330 | Tragic 6.7% |
| Paiute | 0.0 /100 | #331 | Tragic 6.8% |
| Sioux | 0.0 /100 | #332 | Tragic 7.0% |
| Menominee | 0.0 /100 | #333 | Tragic 7.0% |
| Immigrants | Armenia | 0.0 /100 | #334 | Tragic 7.1% |
| Dominicans | 0.0 /100 | #335 | Tragic 7.2% |
| Immigrants | Dominican Republic | 0.0 /100 | #336 | Tragic 7.2% |
| Navajo | 0.0 /100 | #337 | Tragic 7.3% |
| Tohono O'odham | 0.0 /100 | #338 | Tragic 7.7% |
Demographics Similar to Immigrants from Cuba by Female Unemployment
In terms of female unemployment, the demographic groups most similar to Immigrants from Cuba are Cambodian (4.9%, a difference of 0.020%), Slavic (4.9%, a difference of 0.040%), White/Caucasian (4.9%, a difference of 0.070%), Immigrants from Zimbabwe (4.9%, a difference of 0.13%), and Immigrants from Moldova (4.9%, a difference of 0.14%).
| Demographics | Rating | Rank | Female Unemployment |
| Eastern Europeans | 99.4 /100 | #43 | Exceptional 4.9% |
| Greeks | 99.4 /100 | #44 | Exceptional 4.9% |
| Austrians | 99.3 /100 | #45 | Exceptional 4.9% |
| Immigrants | Bulgaria | 99.3 /100 | #46 | Exceptional 4.9% |
| Okinawans | 99.3 /100 | #47 | Exceptional 4.9% |
| Thais | 99.2 /100 | #48 | Exceptional 4.9% |
| Australians | 99.2 /100 | #49 | Exceptional 4.9% |
| Immigrants | Cuba | 99.1 /100 | #50 | Exceptional 4.9% |
| Cambodians | 99.1 /100 | #51 | Exceptional 4.9% |
| Slavs | 99.1 /100 | #52 | Exceptional 4.9% |
| Whites/Caucasians | 99.0 /100 | #53 | Exceptional 4.9% |
| Immigrants | Zimbabwe | 99.0 /100 | #54 | Exceptional 4.9% |
| Immigrants | Moldova | 99.0 /100 | #55 | Exceptional 4.9% |
| Serbians | 99.0 /100 | #56 | Exceptional 4.9% |
| Icelanders | 98.8 /100 | #57 | Exceptional 4.9% |